


Introduction
In this analysis we assess asset class performance during prior cycles of Federal Reserve monetary tightening. Specifically, we measured performance across interest rates, equities, and fixed income the year after the start of rate hike cycles. Additionally, we looked at the impact on U.S. 10-year note yields as well as the slope of the U.S. Treasury curve.
Background
Over the past 30 years, there have been four distinct tightening cycles. We define a tightening cycle as a period when the Fed increased the federal funds rate multiple times.
Exhibit 1: Fed tightening cycles
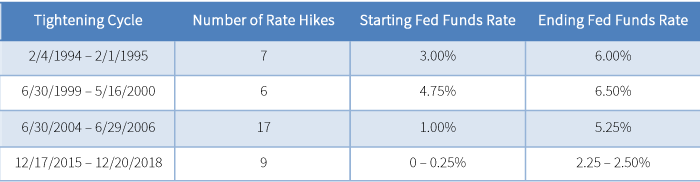
Source: Federal Reserve Board, Putnam
In the sample period, the median number of Fed rate hikes is eight and the median time frame is 18 months, from the first hike until the final hike. Fed policy actions likely caused, or contributed to, economic recessions following the cycles ending in 2000 and 2006.
Impact on rates
The rates market is directly impacted by tightening cycles. Exhibit 2 shows the one-year change in U.S 10-year Treasury yields as well as the slope of the yield curve as defined by the difference in U.S. 10-year Treasury yields and U.S. 2-year Treasury yields. We observe that the yield curve tends to flatten, as short-term rates increased more than long-term rates. On average, the 10-year – 2-year spread compressed by 88 bps, or 0.88%.
Exhibit 2: U.S. 10-year yields and yield curve slope during Fed tightening cycles
Source: Federal Reserve Board, Putnam
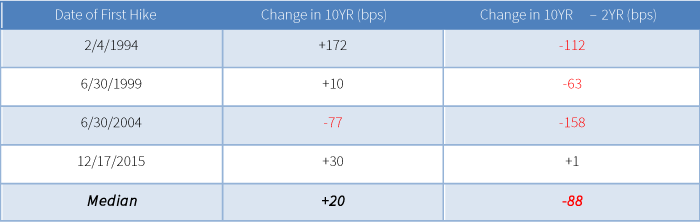
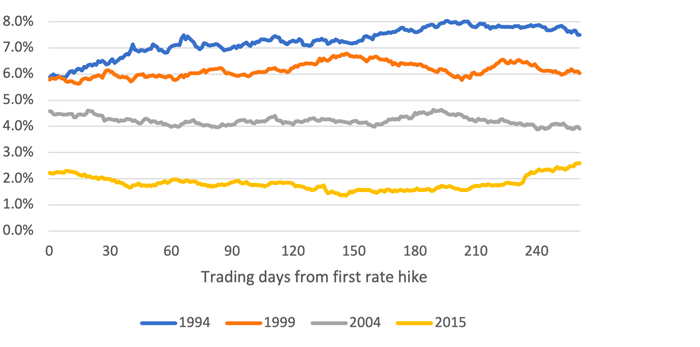
During prior Fed tightening cycles, U.S. 10-year notes saw a median increase in yields of 20 basis points. We also note that the yield curve flattened by a median of 88 basis points. Exhibit 3 illustrates U.S 10-year yields as well as the slope of the yield curve following the first rate hike.
Exhibit 3: Changes in U.S. 10-year Treasury yields and yield curve slope
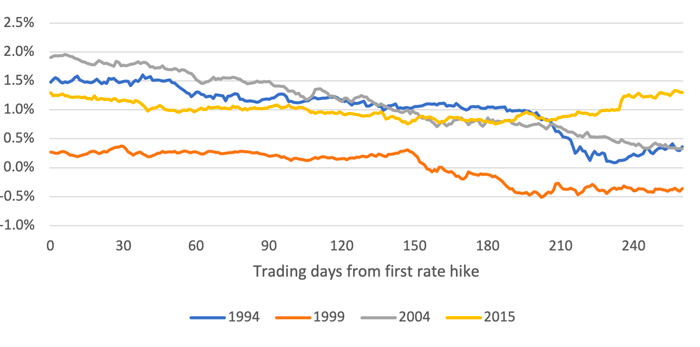
Source: Bloomberg, Putnam
Market Performance
S&P 500 performance
Exhibit 4 illustrates S&P 500 performance in the year following the Fed’s first rate hike. Markets have tended to trade lower in the months following the start of a tightening cycle, but in each case have ended higher one year later.
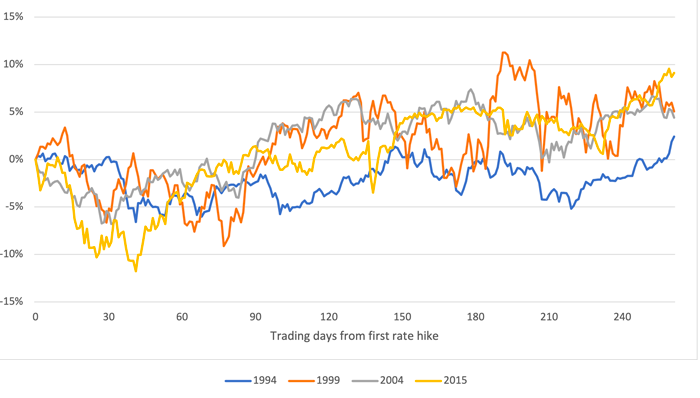
Source: Bloomberg, Putnam
We observe the median drawdown to be 9% in the first 49 days following the Fed’s first rate hike.
Equities by size and style
Exhibit 5: Equity size and style performance one year following the Fed’s first rate hike
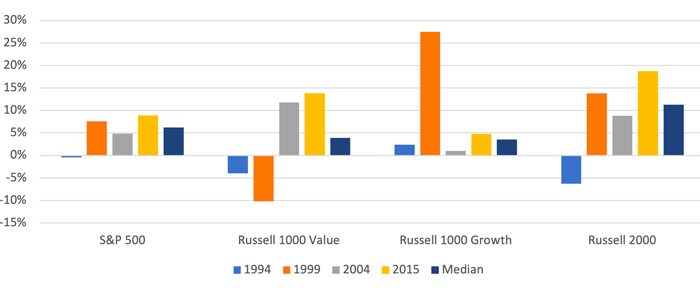
Source: Bloomberg, Putnam
Median returns one year following the Fed’s first rate hike are:
Rates and credit
Exhibit 6: Fixed income performance one year following the Fed’s first rate hike
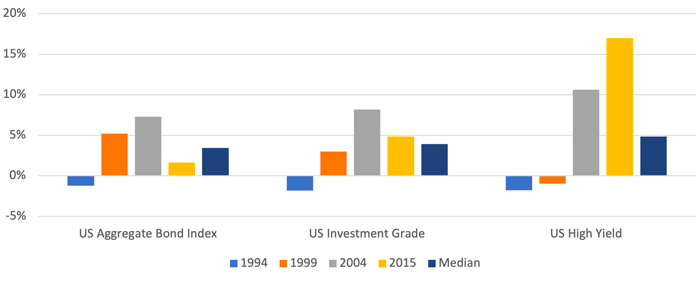
Source: Bloomberg, Putnam
Median returns one year following the Fed’s first rate hike are:
Exhibit 7: Asset class returns across equities and fixed income one year after the Fed’s first rate hike
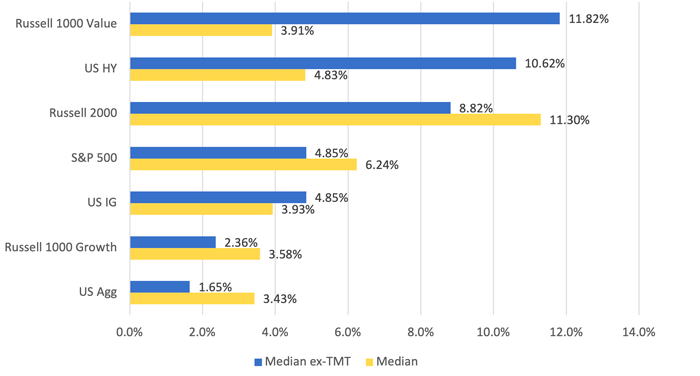
Source: Bloomberg, Putnam
One year following the Fed’s first rate hike, returns across all risk asset classes analyzed are positive. Excluding the TMT bubble of 1999–2000, the strongest returns in the equity space were found in the Russell 1000 value index. Similarly, the strongest returns in fixed-income space were found in U.S. high yield bonds.
Conclusion
The Fed is about to embark on a new tightening cycle. This will likely be the beginning of the fifth tightening cycle in the last 30 years. In the prior four cycles, it is fair to say that the Fed contributed to the recessions following the TMT bubble (2000) and the housing bubble (2006). There were no recessions after the tightening cycles of 1994 and 2015.
We found the median number of rate hikes was eight, spanning a median of 18 months. U.S. 10-year Treasury notes increased by a median of 20 basis points and the slope of the yield curve, as defined by the difference between U.S. 10-year note yields and 2-year note yields, flattened by a median of 88 basis points.
Following the Fed’s first rate hike, the S&P 500 declined by a median of 9% over 49 trading days. One year after the Fed’s first rate hike, the S&P 500 was 6.24% higher at the median.
Within the equity space, the Russell 2000 Index generated a median return of 11.30%, significantly outpacing the returns of large cap indices such as the S&P 500, and the Russell 1000 growth and value measures, excluding the TMT bubble. When we exclude the run up to the TMT bubble, the Russell 1000 Value Index had the highest median return at 11.82%.
Within fixed income, the U.S. high yield bond category generated a median return of 4.83%, outpacing both the U.S. Aggregate Index and U.S. Investment Grade Index. High yield bonds also outperformed in the sample ex-TMT.
For Investment Professional Use Only - Not for public distribution.
Putnam Retail Management
100 Federal Street
Boston, MA 02110
For informational purposes only. Not an investment recommendation.
The views and opinions expressed are those of the author, are subject to change with market conditions and are not meant as investment advice.
Frank Russell Company is the source and owner of the trademarks, service marks, and copyrights related to the Russell Indexes. Russell® is a trademark of Frank Russell Company.
ICE Data Indices, LLC (ICE BofA), used with permission. ICE BofA permits use of the ICE BofA indices and related data on an “as is” basis; makes no warranties regarding same; does not guarantee the suitability, quality, accuracy, timeliness, and/or completeness of the ICE BofA indices or any data included in, related to, or derived therefrom; assumes no liability in connection with the use of the foregoing; and does not sponsor, endorse, or recommend Putnam Investments, or any of its products or services.
BLOOMBERG® is a trademark and service mark of Bloomberg Finance L.P. and its affiliates (collectively “Bloomberg”). Bloomberg or Bloomberg’s licensors own all proprietary rights in the Bloomberg Indices. Neither Bloomberg nor Bloomberg’s licensors approve or endorse this material, or guarantee the accuracy or completeness of any information herein, or make any warranty, express or implied, as to the results to be obtained therefrom, and to the maximum extent allowed by law, neither shall have any liability or responsibility for injury or damages arising in connection therewith.
For informational purposes only. Not an investment recommendation.
This material is provided for limited purposes. It is not intended as an offer or solicitation for the purchase or sale of any financial instrument, or any Putnam product or strategy. References to specific asset classes and financial markets are for illustrative purposes only and are not intended to be, and should not be interpreted as, recommendations or investment advice. The opinions expressed in this article represent the current, good-faith views of the author(s) at the time of publication. The views are provided for informational purposes only and are subject to change. This material does not take into account any investor’s particular investment objectives, strategies, tax status, or investment horizon. Investors should consult a financial advisor for advice suited to their individual financial needs. Putnam Investments cannot guarantee the accuracy or completeness of any statements or data contained in the article. Predictions, opinions, and other information contained in this article are subject to change. Any forward-looking statements speak only as of the date they are made, and Putnam assumes no duty to update them. Forward-looking statements are subject to numerous assumptions, risks, and uncertainties. Actual results could differ materially from those anticipated. Past performance is not a guarantee of future results. As with any investment, there is a potential for profit as well as the possibility of loss.
Diversification does not guarantee a profit or ensure against loss. It is possible to lose money in a diversified portfolio.
Consider these risks before investing: International investing involves certain risks, such as currency fluctuations, economic instability, and political developments. Investments in small and/or midsize companies increase the risk of greater price fluctuations. Bond investments are subject to interest-rate risk, which means the prices of the fund’s bond investments are likely to fall if interest rates rise. Bond investments also are subject to credit risk, which is the risk that the issuer of the bond may default on payment of interest or principal. Interest-rate risk is generally greater for longer-term bonds, and credit risk is generally greater for below-investment-grade bonds, which may be considered speculative. Unlike bonds, funds that invest in bonds have ongoing fees and expenses. Lower-rated bonds may offer higher yields in return for more risk. Funds that invest in government securities are not guaranteed. Mortgage-backed securities are subject to prepayment risk. Commodities involve the risks of changes in market, political, regulatory, and natural conditions. You can lose money by investing in a mutual fund.
Putnam Retail Management.