


- To select a target-date fund (TDF) from among 104 in Morningstar’s database, think about the glide path
- The glide path is a target-date fund’s filter for asset allocation over time
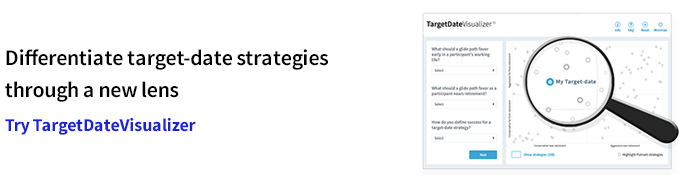
- Consider trying a dynamic tool that can help retirement plan decision makers sort and find TDFs based on their glide path
This spring, we’re bringing our third Dullaghan daughter “online” as a driver as she turns 16. With the prospect of five drivers in our household vying to use a car, we realized it was time to add a midsize SUV. Where else would we begin our search but the internet?
Using a popular search engine and “midsize SUVs for sale” gave me 16 million results. Not so helpful. Adding “in VA” to my search shaved this down to 300,000. Still overwhelming. Using the search feature of a popular national used car specialist brought the total down to 11,400. Getting more useful. Finally, looking only for cars within 100 miles of my location, I was able to get down to 170 matches. Now I could apply final features such as price range, 4WD, etc., to narrow my list to four finalists.
What did I learn? Having a process and the right tool were essential. Being able to document the process also turned out to be critical when my wife looked at the search results and asked, “Why these four?”
From 4WDs to TDFs
How does this story relate to TDFs? Well, the first search engine I used to look for a car reveals 4 billion results when I try the term “target date funds.” This raises the question, what filters should we use? Using “target date glide paths” narrows our results to about 6 million — better, but still too many for a starting point.
It’s fortunate for us Morningstar maintains a smaller, more helpful database of glide paths in its Target-Date Strategy Landscape Report. This resource tracks 104 glide paths for analysis. The reason glide path analysis is helpful in filtering TDFs is that a glide path determines an appropriate mix of asset classes based on where an investor is relative to their investment time horizon. This is known as a TDF’s strategic glide path. Knowing the strategic mix of asset classes will give an investor an expectation of the risk/reward trade-off at various points along the glide path.
TDF searches do not have to be overwhelming if a documentable process is followed.
TargetDateVisualizer steps
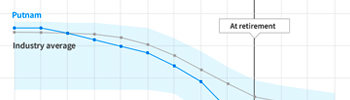
Powered by Morningstar data, TargetDateVisualizer® (TDV) is a powerful glide path analysis tool. From a starting point of all 104 glide paths, TDV analyzes each end of each glide path to compare risk/reward trade-offs. This analysis occurs by comparing 2055 and 2025 vintages to their respective peers, measuring relative stock sensitivity. With this measurement, TDV plots each glide path based on global stock sensitivity (represented by the MSCI All-Country World Index), creating powerful data visualization of all 104 glide paths.
Now that the universe of 104 choices has some order to it, more filtering is available via questions that determine what a plan sponsor is trying to accomplish at various points of the glide path. For example, what is the highest priority for the sponsor for participants near retirement, in a 2025 vintage — maximum growth, maximum downside protection, or something in between?
Reaching a subset
These objective-based filtering questions aim to arrive at a subset of glide paths that best fit the plan sponsor’s situation. They are roughly the equivalent of the “within 100 miles of me” filtering option that reduced my SUV search from 11,000 possibilities to 170. From the subset, up to 5 finalists are selected for thorough “feature” comparison. At this stage, TDV documents the process summarized above through a detailed report that includes risk/reward and other relevant statistics for the final TDF choices.
TDF searches do not have to be overwhelming if a documentable process is followed. A good place to start is to analyze glide path differences and grasp the implications of those differences. By following a careful process and documenting the steps taken along the way, it is possible to narrow the list of 104 glide paths and the TDFs they represent into a best-fit subset.
Use TargetDateVisualizer as your TDF evaluation tool today.
329906
For informational purposes only. Not an investment recommendation.
This material is provided for limited purposes. It is not intended as an offer or solicitation for the purchase or sale of any financial instrument, or any Putnam product or strategy. References to specific asset classes and financial markets are for illustrative purposes only and are not intended to be, and should not be interpreted as, recommendations or investment advice. The opinions expressed in this article represent the current, good-faith views of the author(s) at the time of publication. The views are provided for informational purposes only and are subject to change. This material does not take into account any investor’s particular investment objectives, strategies, tax status, or investment horizon. Investors should consult a financial advisor for advice suited to their individual financial needs. Putnam Investments cannot guarantee the accuracy or completeness of any statements or data contained in the article. Predictions, opinions, and other information contained in this article are subject to change. Any forward-looking statements speak only as of the date they are made, and Putnam assumes no duty to update them. Forward-looking statements are subject to numerous assumptions, risks, and uncertainties. Actual results could differ materially from those anticipated. Past performance is not a guarantee of future results. As with any investment, there is a potential for profit as well as the possibility of loss.
Diversification does not guarantee a profit or ensure against loss. It is possible to lose money in a diversified portfolio.
Consider these risks before investing: International investing involves certain risks, such as currency fluctuations, economic instability, and political developments. Investments in small and/or midsize companies increase the risk of greater price fluctuations. Bond investments are subject to interest-rate risk, which means the prices of the fund’s bond investments are likely to fall if interest rates rise. Bond investments also are subject to credit risk, which is the risk that the issuer of the bond may default on payment of interest or principal. Interest-rate risk is generally greater for longer-term bonds, and credit risk is generally greater for below-investment-grade bonds, which may be considered speculative. Unlike bonds, funds that invest in bonds have ongoing fees and expenses. Lower-rated bonds may offer higher yields in return for more risk. Funds that invest in government securities are not guaranteed. Mortgage-backed securities are subject to prepayment risk. Commodities involve the risks of changes in market, political, regulatory, and natural conditions. You can lose money by investing in a mutual fund.
Putnam Retail Management.