


- The design and management of a target-date strategy creates opportunities to express investment views, manage risk, and meaningfully impact outcomes.
- Active managers are in a unique position to manage risks in every step of the process.
- Fixed income allocation alone is not enough to determine sensitivity to interest-rate risk.
The current interest-rate environment has advisors, consultants, plan sponsors, and participants questioning their fixed income investments. Our three-part Perspectives series has sought to develop a more complete understanding of what rising rates could mean for target-date portfolios. In an earlier post, we explored the long-term investment case for stocks and bonds and then asked: "Are bonds too risky right now?" In this final blog, we consider: Can active management help navigate a rising-rate environment?
Target-date management process
Interest-rate risk is measured in the context of the overall target-date process. In general, there are three steps:
- Design the glide path
- Make asset allocation shifts
- Implement exposures
Each step allows the manager an opportunity to express views, manage risks, and impact outcomes. It is possible to manage interest-rate risk throughout the process.
How active managers mitigate rate risk
Interest-rate risk is part of all fixed income investments but active management can help to address it. Considering the framework cited above, managers can consider a range of strategies.
Design of the glide path
All target-date managers set a glide path to plan how portfolio asset allocation will change over time. Some glide paths emphasize equity exposure leading up to and through retirement. Others transition to emphasize bonds and protect portfolios from potential outsized market declines. In both cases, managers must balance two priorities: generating strong returns to combat a savings shortfall and protecting participants from large drawdowns. To do this, managers adjust the stock and bond mix at different points of the glide path.
In our second post, we examined stock and bond performance during a 20-year period of sharply rising interest rates from the early 1960s to early 1980s. In this challenging environment for fixed income, large drawdowns occurred more frequently and in greater magnitude for equities.
In the following illustration, we expand the sample to include almost 100 years of available data. How managers set up portfolios to deal with such environments is a critical aspect of glide path design.

Sources: Morningstar, Putnam.
This long-term perspective is critical. While bonds can, and do, lose value, there have been 17 independent stock drawdowns of greater magnitude than the largest bond drawdown in our sample. Glide path design governs how the stock and bond mix shifts over time. The glide path must account for the relative riskiness of stocks, both in terms of the frequency and the size of large drawdowns.
Asset allocation shifts
Dynamic asset allocation decisions can express an active view on interest-rate risk. At times it is an attractive risk to take, and an active manager will want more exposure. At other times it will be less attractive, and managers will own less. When stock and bond volatility is high, advisors, consultants, and plan sponsors may want a target-date manager with the ability to make tactical adjustments to their exposure to interest-rate risk.
When choosing a strategy, consider these important questions:
- Does the target-date series have tactical allocation flexibility?
- How much allocation flexibility does the manager have?
- What success has the manager had in delivering alpha from allocation shifts?
Volatility presents both challenges and opportunities. Active managers with a demonstrated ability to add value through allocation shifts could be well positioned to navigate this environment and outperform more static peers.
Security selection decisions
Not all fixed income investments contain the same amount of interest-rate risk. For example, the U.S. Aggregate Bond Index currently has a duration of over six years. Historically the index has derived 90% of its total risk from movements in interest rates. Other sectors of the bond market contain very different risk profiles.
An advantage of an active approach is the ability to own out-of-benchmark fixed income sectors such as high-yield bonds or commercial and residential mortgage-backed securities, among others. These sectors offer the potential to diversify risk exposures. In contrast, many passive approaches are limited to owning exposures similar to the U.S. Aggregate Bond Index. If this is the case, participant fixed income allocations will likely be dominated by interest-rate risk.
Fixed income allocation does not equal interest-rate risk
Active managers who can own more diversified fixed income exposures are likely to deliver performance different from benchmarks. Evaluating exposure to interest-rate risk, for example, would require more than just a comparison of strategies' total fixed income allocations. Looking beyond the allocation to the composition of fixed income exposure helps identify the risks the manager is taking.
Consider the following four glide paths. For simplicity, we've labeled them managers A, B, C, and D and listed them in order of fixed income allocation at retirement. Manager A has the highest fixed income allocation just before the target date, and Manager D has the least.
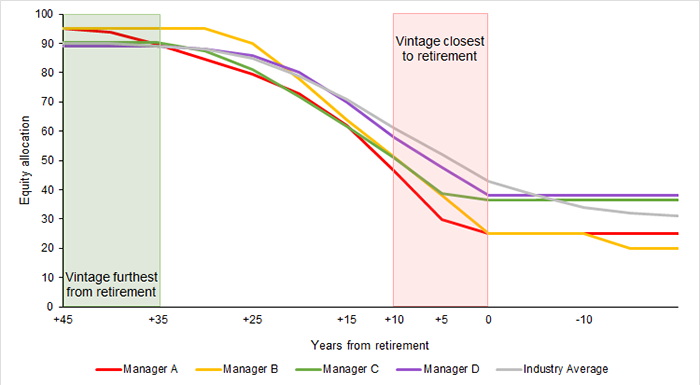
A cursory review would suggest that Manager A, with a higher allocation to fixed income, would have greater exposure to interest-rate risk. If a consultant or plan sponsor were expecting higher interest rates and evaluating managers based solely on the glide path information above, it would be reasonable to expect Manager A to underperform the other managers near retirement. Fortunately, tools such as TargetDateVisualizer afford consultants and plan sponsors a more granular look at the risks each of these managers take.
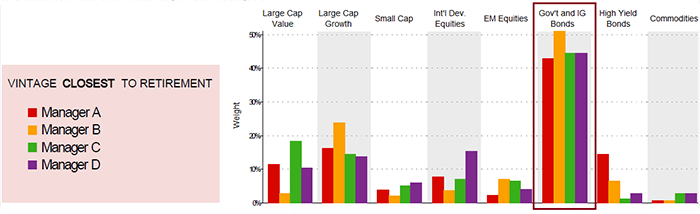
Estimated asset class weightings (July 2017–June 2022)
Using returns-based style analysis, it is possible to estimate the amount of exposure to key asset classes. These asset classes will make up the vast majority of investments for target-date managers.
Asset class weights are estimated using a multivariate regression. Data is historical. Past performance is not a guarantee of future results. More recent returns may be more or less than those shown. Investment return will fluctuate. Performance assumes reinvestment of distributions and does not account for taxes. Performance data reflects impact of applicable management fees for each target-date series. In certain cases your plan's management fee may be lower and your return higher. For the most recent month-end performance, please call your plan's toll-free number. Like the output of any model, this analysis may be subject to limitations, is not guaranteed, and may produce results that diverge from any client's past of future performance.
For one-on-one use with TargetDateVisualizer® - analysis only. Not for public distribution.
Notice that Manager A, despite having the highest allocation to fixed income, demonstrates the lowest sensitivity to government and investment-grade bonds — the factor most synonymous with interest-rate risk. In a rising rate environment, all else equal, one would expect Manager A to outperform, not underperform, the other managers near retirement.
Conclusion
Each step of the target-date process presents an opportunity for the manager to express views, manage risks, and impact outcomes. Active managers, with the ability to adjust portfolios throughout the target-date management process, are in a unique position to navigate a potential rising rate environment. Advisors can use tools such as TargetDateVisualizer, to go beyond stated fixed income allocations and get a better sense for the true interest rate sensitivity of their target-date managers.
Advisors can use the output from TargetDateVisualizer as a target-date analysis report to see bond allocations and professionally evaluate and document the diversification of glide paths. The tool captures data from more than 100 target-date strategies.

The Bloomberg U.S. Aggregate Bond Index is an unmanaged index of U.S. investment-grade fixed income securities. You cannot directly invest in an index.
BLOOMBERG® is a trademark and service mark of Bloomberg Finance L.P. and its affiliates (collectively "Bloomberg"). Bloomberg or Bloomberg's licensors own all proprietary rights in the Bloomberg Indices. Neither Bloomberg nor Bloomberg's licensors approve or endorse this material, or guarantee the accuracy or completeness of any information herein, or make any warranty, express or implied, as to the results to be obtained therefrom, and to the maximum extent allowed by law, neither shall have any liability or responsibility for injury or damages arising in connection therewith.
The principal value of target-date funds is not guaranteed at any time, including the target date.
330882
For informational purposes only. Not an investment recommendation.
This material is provided for limited purposes. It is not intended as an offer or solicitation for the purchase or sale of any financial instrument, or any Putnam product or strategy. References to specific asset classes and financial markets are for illustrative purposes only and are not intended to be, and should not be interpreted as, recommendations or investment advice. The opinions expressed in this article represent the current, good-faith views of the author(s) at the time of publication. The views are provided for informational purposes only and are subject to change. This material does not take into account any investor’s particular investment objectives, strategies, tax status, or investment horizon. Investors should consult a financial advisor for advice suited to their individual financial needs. Putnam Investments cannot guarantee the accuracy or completeness of any statements or data contained in the article. Predictions, opinions, and other information contained in this article are subject to change. Any forward-looking statements speak only as of the date they are made, and Putnam assumes no duty to update them. Forward-looking statements are subject to numerous assumptions, risks, and uncertainties. Actual results could differ materially from those anticipated. Past performance is not a guarantee of future results. As with any investment, there is a potential for profit as well as the possibility of loss.
Diversification does not guarantee a profit or ensure against loss. It is possible to lose money in a diversified portfolio.
Consider these risks before investing: International investing involves certain risks, such as currency fluctuations, economic instability, and political developments. Investments in small and/or midsize companies increase the risk of greater price fluctuations. Bond investments are subject to interest-rate risk, which means the prices of the fund’s bond investments are likely to fall if interest rates rise. Bond investments also are subject to credit risk, which is the risk that the issuer of the bond may default on payment of interest or principal. Interest-rate risk is generally greater for longer-term bonds, and credit risk is generally greater for below-investment-grade bonds, which may be considered speculative. Unlike bonds, funds that invest in bonds have ongoing fees and expenses. Lower-rated bonds may offer higher yields in return for more risk. Funds that invest in government securities are not guaranteed. Mortgage-backed securities are subject to prepayment risk. Commodities involve the risks of changes in market, political, regulatory, and natural conditions. You can lose money by investing in a mutual fund.
Putnam Retail Management.