


With the market currently anticipating the completion of the Fed's interest-rate hikes at its May meeting, we analyze historical rate cycles to offer guidance on fixed income allocations.
- We identify the historical framework of six previous Fed rate-hiking cycles over the past 40 years.
- Fixed income fund categories follow a path of underperforming cash before the end of a cycle, but then outperforming cash after the end of a cycle.
- We believe the current cycle could follow historical precedent, and therefore it may be an attractive time for investors to consider putting cash to work farther out the fixed income curve.
With the volatility in fixed income markets over the past 12 to 15 months, a common question during client conversations is, “What should we be doing with our fixed income allocation?” Investors have either reduced traditional fixed income allocations, shortened duration, or piled money into cash or money market vehicles as a result of the aggressive policy actions taken by central bankers. In this year alone, money market fund assets are up over $400 billion and currently stand at just over $5.6 trillion (according to Crane data). However, the growing consensus is that the Fed is at or near the end of the current hiking cycle and that the last hike in the policy rate may occur at its May 2–3 meeting.
To better guide decisions on fixed income allocations around turns in Fed policy, history may provide a useful framework.
The historical framework of rate-hiking cycles
To formally denote the ends of Fed hiking cycles, we examine the federal funds effective rate. Figure 1 plots the rate from December 1983 to the present. We can identify six distinct peaks in the effective rate that coincide with either major pauses or the end of a hiking cycle. Those peaks are: (1) August 1984, (2) February 1989, (3) February 1995, (4) May 2000, (5) June 2006, and (6) December 2018.
Figure 1. Interest-rate peaks and pauses denote six Fed policy cycles in the past 40 years
Federal funds effective rate (December 1983–present)

Source: Federal Reserve Bank of St. Louis.
Performance of bond fund categories before and after peaks
With this historical framework identified, we analyze the performance of various bond fund investment styles/categories. Morningstar category average data allows us to observe a bias-free time series of the average performance of funds in three key categories: (1) Ultrashort Bond, (2) Short-Term Bond, and (3) Intermediate Core-Plus Bond. These three categories are representative of various risk and duration postures for fixed income allocations.
Next, we analyze each category's average cumulative performance versus cash in the 12 months before and after the end of Fed hikes, as illustrated in Figure 2. All three underperform cash in the 12 months before the end of the cycle, as evidenced by the downward sloping lines in the chart. Additionally, the relative performance among the categories is consistent with the duration posture (e.g., Ultrashort Bond underperforms by the least, and Intermediate Core-Plus Bond by the most). What is also easily observable is that these categories begin to outperform cash after the end of the previous hiking cycles, with a similar relationship between categories. It is also interesting to note that for the longer-duration categories, such as Intermediate Core-Plus Bond, which is often benchmarked to the Bloomberg U.S. Aggregate Bond Index, the turn in performance begins 2–3 months prior to the last hike.
Figure 2. Bond fund categories outperform cash after the end of past hiking cycles
Average bond fund excess performance vs. cash around the past six Fed hiking cycles (rebased to 100 at last hike)

Sources: Morningstar, Putnam Investments.
The current cycle is following the path of the historical framework
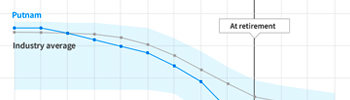
Some may suggest the current cycle is unique given how aggressively the Fed has raised interest rates, and that history may not be a useful guide. We would argue, however, that recent performance is largely following the same general path as we have seen historically, despite the sharp move higher in rates over the past 12 months. Though we do not know with 100% certainty when the last hike will be, if the May 2023 meeting coincides with the end of the current cycle, we can plot the performance leading up to that date. Figure 3 shows the three categories' excess performance versus cash in the current cycle. May 2022 would hypothetically represent the beginning of a 12-month period prior to the last hike. The underperformance for both the Ultrashort Bond and Short-Term Bond categories are in line with the historical average. While the Intermediate Core-Plus Bond category has experienced a slightly larger drawdown on average, it is not a historical outlier.
Figure 3. Performance since May 2022 largely matches the historical pattern among the categories
Bond fund categories' excess performance vs. cash (May 2022 to present)

Sources: Morningstar, Putnam Investments.
It is both the market (as implied by federal funds futures) and Putnam's view that the Fed's last hike may be on the horizon, likely at its next meeting in May. Given this view, we believe now may be an attractive time to look for strategies that have historically outperformed cash after the Fed finishes tightening policy.
- Ultrashort Bond: For investors who have historically looked to the category as the first step outside of cash, seek capital preservation, or have cash needs within one year (Putnam solution: Ultra Short Duration Income Fund)
- Short-Term Bond: For investors looking to extend duration but still be shorter than the Bloomberg U.S. Aggregate Bond Index, who want a high-quality portfolio, and/or who have a time horizon of less than two years (Putnam solution: Short Duration Bond Fund)
- Intermediate Core/Core-Plus Bond: For investors who want duration to match the Bloomberg U.S. Aggregate Bond Index, or are using fixed income as a strategic allocation in a multi-asset portfolio with a longer time horizon (Putnam solution: Core Bond Fund and Income Fund)
For informational purposes only. Not an investment recommendation.
This material is provided for limited purposes. It is not intended as an offer or solicitation for the purchase or sale of any financial instrument, or any Putnam product or strategy. References to specific asset classes and financial markets are for illustrative purposes only and are not intended to be, and should not be interpreted as, recommendations or investment advice. The opinions expressed in this article represent the current, good-faith views of the author(s) at the time of publication. The views are provided for informational purposes only and are subject to change. This material does not take into account any investor’s particular investment objectives, strategies, tax status, or investment horizon. Investors should consult a financial advisor for advice suited to their individual financial needs. Putnam Investments cannot guarantee the accuracy or completeness of any statements or data contained in the article. Predictions, opinions, and other information contained in this article are subject to change. Any forward-looking statements speak only as of the date they are made, and Putnam assumes no duty to update them. Forward-looking statements are subject to numerous assumptions, risks, and uncertainties. Actual results could differ materially from those anticipated. Past performance is not a guarantee of future results. As with any investment, there is a potential for profit as well as the possibility of loss.
Diversification does not guarantee a profit or ensure against loss. It is possible to lose money in a diversified portfolio.
Consider these risks before investing: International investing involves certain risks, such as currency fluctuations, economic instability, and political developments. Investments in small and/or midsize companies increase the risk of greater price fluctuations. Bond investments are subject to interest-rate risk, which means the prices of the fund’s bond investments are likely to fall if interest rates rise. Bond investments also are subject to credit risk, which is the risk that the issuer of the bond may default on payment of interest or principal. Interest-rate risk is generally greater for longer-term bonds, and credit risk is generally greater for below-investment-grade bonds, which may be considered speculative. Unlike bonds, funds that invest in bonds have ongoing fees and expenses. Lower-rated bonds may offer higher yields in return for more risk. Funds that invest in government securities are not guaranteed. Mortgage-backed securities are subject to prepayment risk. Commodities involve the risks of changes in market, political, regulatory, and natural conditions. You can lose money by investing in a mutual fund.
Putnam Retail Management.