


Current performance may be lower or higher than the quoted past performance, which cannot guarantee future results. Share price, principal value, and return will vary, and you may have a gain or loss when you sell your shares. Performance assumes reinvestment of distributions and does not account for taxes. The "before sales charge" performance does not reflect the current maximum sales charges, which we explain below. If performance did reflect the charges, it would be lower. The "after sales charge" performance (or returns at public offering price) varies by share class and fund. For class A and class M shares, the current maximum initial sales charges are 5.75% and 3.50% for equity funds and 4.00% and 3.25% for income funds, respectively (with these exceptions: 2.25% for class A of Floating Rate Income Fund, Short-Term Municipal Income Fund, Short Duration Bond Fund, and Strategic Intermediate Municipal Fund). Class B share performance reflects the applicable contingent deferred sales charge (CDSC), which is 5% in the first year, declines to 1% in the sixth year, and is eliminated thereafter (except for Floating Rate Income Fund and Short Duration Bond Fund; for these funds, the CDSC is 1% in the first year, declines to 0.5% in the second year, and is eliminated thereafter). Class C share performance reflects a 1% CDSC the first year that is eliminated thereafter. Performance for class B, C, M, N, R, and Y shares prior to their inception is derived from the historical performance of class A shares by adjusting for the applicable sales charge (or CDSC) and, except for class Y shares, the higher operating expenses for such shares (note, for two funds - Tax-Free High Yield Fund and Strategic Intermediate Municipal Fund performance prior to inception is based on the historical performance of class B shares). Performance for class A, C, R6, and Y shares of Mortgage Opportunities Fund before their inception is derived from the historical performance of class I shares, which has been adjusted for the applicable sales charge (or CDSC) and the higher operating expenses for such shares. The "after sales charge" performance (at public offering price) for class N shares reflects the current maximum initial sales charge of 1.50%. Class R, R3, R4, R5, and R6 shares, which are available to qualified employee-benefit plans only, are sold without an initial sales charge and have no CDSC. Class Y shares are generally only available for corporate and institutional clients and have no initial sales charge. Performance for class R3 and R4 shares prior to their inception is derived from the historical performance of class Y shares by adjusting for the higher operating expenses for such shares. Performance for class R5 shares before their inception is derived from the historical performance of class Y shares, which has not been adjusted for the lower expenses; had it been adjusted, performance would be higher (with the exception of the Sustainable Retirement Maturity, 2025, 2030, 2035, and 2040 Funds, for which performance is derived from the historical performance of class R6 shares and has been adjusted for the higher operating expenses for such shares; and the Sustainable Retirement 2045, 2050, 2055, and 2060 Funds, for which performance is derived from the historical performance of class R6 shares and has not been adjusted for the lower expenses; had it been adjusted, performance would be higher). Performance for class R6 shares before their inception is derived from the historical performance of class Y shares, which has not been adjusted for the lower operating expenses; had it been adjusted, performance would be higher. For a portion of the period, some funds had expenses limitations or had been sold on a limited basis with limited assets and expenses. Had these limits not been in place, performance would be lower.
Active Sustainability
Sustainable Future Fund (Class Y) (PMVYX)
Investing in sustainability solutions
Manager commentary: A challenging quarter for financial markets and growth stocks
Highlights
Objective
The fund seeks long-term capital appreciation.
Strategy and process
- Solutions focus Invests in companies whose products and services provide solutions to key sustainability challenges
- Active research process Integrates relevant and forward-looking sustainability analysis with high-quality fundamental research to drive investment decisions
- Integrated, experienced teamManaged by dedicated and experienced sustainable investing team embedded within Putnam’s equity research and quantitative/risk analysis groups.
Fund price and assets |
Prior close | 52-week high | 52-week low | Net assets and outstanding shares |
|---|---|---|---|---|
| Net asset value |
$20.60
-0.29% | $-0.06 |
$21.99
03/28/24 |
$15.87
10/27/23 |
Download CSV |
Consistency of positive performance over five years
Performance shown does not reflect the effects of any sales charges. Click on the dots to see specific returns in each 5-year period as of the date revealed. Note that returns of 0.00% are counted as positive periods. For complete fund performance, please click on the performance tab.
26.06%
Best 5-year annualized return
(for period ending 03/31/14)
-5.20%
Worst 5-year annualized return
(for period ending 03/31/09)
9.91%
Average 5-year annualized return
Fund facts as of 03/31/24
$427.21M
43%
Annually
73
April
746802198 / 1856
04/02/02
Growth
PMVYX
Management team


Literature
Fund information and commentary |
|
| Fact Sheet (R6 share) (PDF) | |
| Fact Sheet (YA share) (PDF) | |
| Fund Brochure (PDF) |
|
| Engagement and Stewardship Report (PDF) |
|
| Q&A Doc: Strategy Repositioning (PDF) | |
Legal documents |
|
| Summary Prospectus (PDF) | |
| Statutory Prospectus (PDF) | |
| Annual Report (PDF) |
|
| Semiannual Report (PDF) |
|
| Statement of Additional Information (SAI) (PDF) | |
| Proxy voting results (Form N-PX) (PDF) | |
Learn more about our approach to Sustainable Investing
Featured items
-
Sustainability and impact report: A dialogue with investors
We are pleased to share our annual assessment of sustainability and impact for Putnam Sustainable Leaders Fund and Putnam Sustainable Future Fund. -
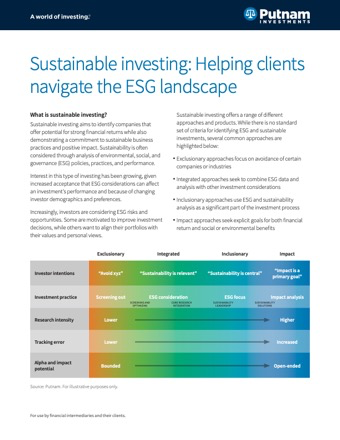
Sustainable investing: Helping clients navigate the ESG landscape
Use this questionnaire to help assess client preferences for ESG investment strategies.
Recent research publications
Toward a circular economy
As the global economy demands more resources than Earth can sustain, our researchers explore the concept of the circular economy, and how it can inform business leaders and investors to optimize resource use and minimize waste.Toward racial justice
Using the social (S) lens of ESG investing, our researchers explain the markers of leadership among U.S. corporations addressing the challenge of racial justice.
Performance
Total return (%) as of 03/31/24
Annual performance as of 03/31/24
Annualized Total return (%) as of 03/31/24
| Annualized performance | 1 yr. | 3 yrs. | 5 yrs. | 10 yrs. |
|---|---|---|---|---|
| Before sales charge | 32.31% | -0.43% | 11.37% | 9.32% |
| After sales charge | N/A | N/A | N/A | N/A |
| Russell Midcap Growth Index | 26.28% | 4.62% | 11.82% | 11.35% |
| Putnam Sustainable Future Linked Benchmark | 26.28% | 4.62% | 11.82% | 10.18% |
Performance snapshot
| Before sales charge | After sales charge | ||
|---|---|---|---|
| 1 mt. as of 03/31/24 | 2.76% | - | |
| YTD as of 04/18/24 or prior close | 4.52% | - | |
Risk-adjusted performance as of 03/31/24
| Alpha (3 yrs.) | -5.02 |
|---|---|
| Sharpe ratio (3 yrs.) | -0.14 |
| Treynor ratio (3 yrs.) | -3.03 |
| Information ratio (3 yrs.) | -1.15 |
Volatility as of 03/31/24
| Standard deviation (3 yrs.) | 21.56% |
|---|---|
| Beta | 0.98 |
| R-squared | 0.96 |
Capture ratio as of 03/31/24
| Up-market (3 yrs.) | 91.51 |
|---|---|
| Down-market (3 yrs.) | 107.84 |
Lipper rankings as of 03/31/24
| Time period | Rank/Funds in category | Percentile ranking |
|---|---|---|
| 1 yr. | 229/410 | 56% |
| 3 yrs. | 287/385 | 75% |
| 5 yrs. | 232/357 | 65% |
| 10 yrs. | 223/273 | 82% |
Morningstar Ratings™ as of 03/31/24
| Time period | Funds in category | Morningstar Rating™ |
|---|---|---|
| Overall | 520 | |
| 3 yrs. | 520 | |
| 5 yrs. | 489 | |
| 10 yrs. | 393 |
Lipper rankings are based on total return without sales charge relative to all share classes of funds with similar objectives as determined by Lipper. Past performance is not indicative of future results.
Morningstar Ratings for the specific share classes only; other classes may have different performance characteristics.
The Morningstar Rating™ for funds, or "star rating", is calculated for managed products (including mutual funds, variable annuity and variable life subaccounts, exchange-traded funds, closed-end funds, and separate accounts) with at least a 3-year history. Exchange-traded funds and open-ended mutual funds are considered a single population for comparative purposes. It is calculated based on a Morningstar Risk-Adjusted Return measure that accounts for variation in a managed product's monthly excess performance, placing more emphasis on downward variations and rewarding consistent performance. The Morningstar Rating does not include any adjustment for sales loads. The top 10% of products in each product category receive 5 stars, the next 22.5% receive 4 stars, the next 35% receive 3 stars, the next 22.5% receive 2 stars, and the bottom 10% receive 1 star. The Overall Morningstar Rating for a managed product is derived from a weighted average of the performance figures associated with its 3-, 5-, and 10-year (if applicable) Morningstar Rating metrics. The weights are: 100% 3-year rating for 36–59 months of total returns, 60% 5-year rating/40% 3-year rating for 60–119 months of total returns, and 50% 10-year rating/30% 5-year rating/20% 3-year rating for 120 or more months of total returns. While the 10-year overall star rating formula seems to give the most weight to the 10-year period, the most recent 3-year period actually has the greatest impact because it is included in all three rating periods.
Some of Morningstar's proprietary calculations, including the Morningstar Rating™, are not customarily calculated based on adjusted historical returns. However, for new share classes/channels, Morningstar may calculate an extended performance Morningstar Rating that is based, in part, on adjusted historical (or "pre-inception") returns for periods prior to the inception of the share class of the fund shown herein ("Report Share Class").
The extended performance is calculated by creating a performance stream consisting of the Report Share Class and older share class(s). Morningstar adjusts the historical total returns of the older share class(es) of a fund to reflect higher expenses in the Report Share Class. Morningstar does not hypothetically adjust returns upwards for lower expenses.
The extended performance Morningstar Risk-Adjusted Return is then calculated for 3-, 5-, and 10-year time periods and used to determine the extended performance Morningstar Rating. The extended performance Morningstar Rating for this fund does not affect the retail fund data published by Morningstar, as the bell curve distribution on which the ratings are based includes only funds with actual returns. The Overall Morningstar Rating for multi-share open-end funds will be either based on actual performance only or extended performance only. Once the share class turns three years old, the Overall Morningstar Rating will be based on actual ratings only. The Overall Morningstar Rating for multi-share variable annuities is based on a weighted average of any ratings that are available.
While the inclusion of pre-inception data, in the form of extended performance, can provide valuable insight into the probable long-term behavior of newer share classes of a fund, investors should be aware that an adjusted historical return can only provide an approximation of that behavior. For example, the fee structures of a retail share class will vary from that of an institutional share class, as retail shares tend to have higher operating expenses and sales charges. These adjusted historical returns are not actual returns. The underlying investments in the share classes used to calculate the pre-performance string will likely vary from the underlying investments held in the fund after inception. Calculation methodologies utilized by Morningstar may differ from those applied by other entities, including the fund itself.
© 2023 Morningstar. All Rights Reserved. The information contained herein: (1) is proprietary to Morningstar and/or its content providers; (2) may not be copied or distributed; and (3) is not warranted to be accurate, complete or timely. Neither Morningstar nor its content providers are responsible for any damages or losses arising from any use of this information. Past performance is no guarantee of future results.
The up-market capture ratio is used to evaluate how well an investment manager performed relative to an index during periods when that index has risen. The ratio is calculated by dividing the manager’s returns by the returns of the index during the up-market, and multiplying that factor by 100. The down-market capture ratio is used to evaluate how well an investment manager performed relative to an index during periods when that index has dropped. The ratio is calculated by dividing the manager’s returns by the returns of the index during the down-market and multiplying that factor by 100.
Compare
See how this fund stacks up against its peers with FundVisualizer®
New to FundVisualizer? Watch tutorials on how to get started.


For more tutorials, please visit fundvisualizer.com
** FundVisualizer comparison based on Putnam fund versus the largest fund in its Morningstar category.
Holdings
| Cintas Corp | 3.30% |
|---|---|
| Dexcom | 2.90% |
| Constellation Energy Corp | 2.44% |
| Federal Signal Corp | 2.38% |
| Crowdstrike Holdings | 2.38% |
| Roper Technologies | 2.31% |
| Mettler-Toledo International | 2.27% |
| Resmed | 2.21% |
| Chipotle Mexican Grill | 2.18% |
| Thermo Fisher Scientific | 2.14% |
| Top 10 holdings, percent of portfolio | 24.50% |
| Top 10 holdings as of 03/31/24 | |
|---|---|
| Cintas Corp | |
| Dexcom | |
| Constellation Energy Corp | |
| Federal Signal Corp | |
| Crowdstrike Holdings | |
| Roper Technologies | |
| Mettler-Toledo International | |
| Resmed | |
| Chipotle Mexican Grill | |
| Thermo Fisher Scientific | |
| Holdings represent 24.50% of portfolio | |
| Top 10 holdings as of 02/29/24 | |
|---|---|
| Cintas Corp | |
| Sprouts Farmers Market | |
| Constellation Energy Corp | |
| Dexcom | |
| Crowdstrike Holdings | |
| Federal Signal Corp | |
| Mastercard | |
| Roper Technologies | |
| Idexx Laboratories | |
| Chipotle Mexican Grill | |
| Holdings represent 24.48% of portfolio | |
| Top 10 holdings as of 01/31/24 | |
|---|---|
| Cintas Corp | |
| Dexcom | |
| Roper Technologies | |
| Sprouts Farmers Market | |
| Nvidia Corp | |
| Servicenow | |
| Crowdstrike Holdings | |
| Federal Signal Corp | |
| Mastercard | |
| Msci | |
| Holdings represent 24.32% of portfolio | |
| Top 10 holdings as of 12/31/23 | |
|---|---|
| Cintas Corp | |
| Dexcom | |
| Federal Signal Corp | |
| Adobe | |
| Roper Technologies | |
| Idexx Laboratories | |
| Sprouts Farmers Market | |
| Mastercard | |
| Fair Isaac Corp | |
| Msci | |
| Holdings represent 24.20% of portfolio | |

Portfolio composition as of 03/31/24
| Common stock | 97.81% |
|---|---|
| Cash and net other assets | 2.19% |
Equity statistics as of 03/31/24
| Median market cap | $28.47B |
|---|---|
| Weighted average market cap | $107.85B |
| Price to book | 6.71 |
| Price to earnings | 34.04 |
Fund characteristics will vary over time.
Due to rounding, percentages may not equal 100%.
Consider these risks before investing: The value of investments in the fund’s portfolio may fall or fail to rise over extended periods of time for a variety of reasons, including general economic, political, or financial market conditions; investor sentiment and market perceptions; government actions; geopolitical events or changes; and factors related to a specific issuer, geography, industry, or sector. These and other factors may lead to increased volatility and reduced liquidity in the fund’s portfolio holdings.
Growth stocks may be more susceptible to earnings disappointments and the market may not favor growth-style investing. Investments in small and midsize companies increase the risk of greater price fluctuations. From time to time, the fund may invest a significant portion of its assets in companies in one or more related industries or sectors, which would make the fund more vulnerable to adverse developments affecting those companies, industries, or sectors. International investing involves currency, economic, and political risks. Investing with a focus on companies whose products and services produce positive environmental, social, and economic development impact may result in the fund investing in certain types of companies, industries, or sectors that underperform the market as a whole. In evaluating an investment opportunity, we may make investment decisions based on information and data that is incomplete or inaccurate. Due to changes in the products or services of the companies in which the fund invests, the fund may temporarily hold securities that are inconsistent with its sustainable investment criteria.
Our investment techniques, analyses, and judgments may not produce the outcome we intend. The investments we select for the fund may not perform as well as other securities that we do not select for the fund. We, or the fund’s other service providers, may experience disruptions or operating errors that could have a negative effect on the fund. You can lose money by investing in the fund.
Sector weightings as of 03/31/24
| Information technology | 27.99% |
|---|---|
| Health care | 25.73% |
| Industrials | 16.82% |
| Consumer discretionary | 8.63% |
| Financials | 6.75% |
| Consumer staples | 3.60% |
| Materials | 3.50% |
| Utilities | 2.44% |
| Cash and net other assets | 2.19% |
| Other | 2.36% |
0
The unclassified sector (where applicable) includes exchange traded funds and other securities not able to be classified by sector.
Sectors will vary over time.
Expenses
Expense ratio |
Class A | Class B | Class C | Class R | Class R6 | Class Y |
|---|---|---|---|---|---|---|
| Total expense ratio | 1.06% | 1.81% | 1.81% | 1.31% | 0.68% | 0.81% |
| What you pay | 1.06% | 1.81% | 1.81% | 1.31% | 0.68% | 0.81% |
Sales charge
| Breakpoint | Class A | Class B | Class C | Class R | Class R6 | Class Y |
|---|---|---|---|---|---|---|
| $0-$49,999 | 5.75% / 5.00% | 0.00% / 4.00% | 0.00% / 1.00% | -- | -- | -- |
| $50,000-$99,999 | 4.50% / 3.75% | 0.00% / 4.00% | 0.00% / 1.00% | -- | -- | -- |
| $100,000-$249,999 | 3.50% / 2.75% | -- | 0.00% / 1.00% | -- | -- | -- |
| $250,000-$499,999 | 2.50% / 2.00% | -- | 0.00% / 1.00% | -- | -- | -- |
| $500,000-$999,999 | 2.00% / 1.75% | -- | 0.00% / 1.00% | -- | -- | -- |
| $1M-$4M | 0.00% / 1.00% | -- | -- | -- | -- | -- |
| $4M-$50M | 0.00% / 0.50% | -- | -- | -- | -- | -- |
| $50M+ | 0.00% / 0.25% | -- | -- | -- | -- | -- |
CDSC
| Class A (sales for $1,000,000+) | Class B | Class C | Class R | Class R6 | Class Y | |
|---|---|---|---|---|---|---|
| 0 to 9 mts. | 1.00% | 5.00% | 1.00% | -- | -- | -- |
| 9 to 12 mts. | 1.00% | 5.00% | 1.00% | -- | -- | -- |
| 2 yrs. | 0.00% | 4.00% | 0.00% | -- | -- | -- |
| 3 yrs. | 0.00% | 3.00% | 0.00% | -- | -- | -- |
| 4 yrs. | 0.00% | 3.00% | 0.00% | -- | -- | -- |
| 5 yrs. | 0.00% | 2.00% | 0.00% | -- | -- | -- |
| 6 yrs. | 0.00% | 0.00% | 0.00% | -- | -- | -- |
| 7+ yrs. | 0.00% | 0.00% | 0.00% | -- | -- | -- |
Trail commissions
| Class A | Class B | Class C | Class R | Class R6 | Class Y | |
|---|---|---|---|---|---|---|
| 0.25% | 0.25% | 1.00% | 0.50% | 0.00% | 0.00% | |
| NA | NA | NA | NA | NA | NA | |
| NA | NA | NA | NA | NA | NA |
For sales and trail commission information on purchases over $1 million and participant-directed qualified retirement plans, see a Putnam fund prospectus and the statement of additional information.
The Russell Midcap® Growth Index is an unmanaged index of those companies in the Russell Midcap® Index chosen for their growth orientation. The Russell 3000® Value Index is an unmanaged index of those companies in the broad-market Russell 3000® Index chosen for their value orientation. The Putnam Sustainable Future Linked Benchmark represents the performance of the Russell 3000 Value Index through March 20, 2018, and the performance of the Russell Midcap Growth Index thereafter. You cannot invest directly in an index.
Consider these risks before investing: The value of investments in the fund’s portfolio may fall or fail to rise over extended periods of time for a variety of reasons, including general economic, political, or financial market conditions; investor sentiment and market perceptions; government actions; geopolitical events or changes; and factors related to a specific issuer, geography, industry, or sector. These and other factors may lead to increased volatility and reduced liquidity in the fund’s portfolio holdings.
Growth stocks may be more susceptible to earnings disappointments and the market may not favor growth-style investing. Investments in small and midsize companies increase the risk of greater price fluctuations. From time to time, the fund may invest a significant portion of its assets in companies in one or more related industries or sectors, which would make the fund more vulnerable to adverse developments affecting those companies, industries, or sectors. International investing involves currency, economic, and political risks. Investing with a focus on companies whose products and services produce positive environmental, social, and economic development impact may result in the fund investing in certain types of companies, industries, or sectors that underperform the market as a whole. In evaluating an investment opportunity, we may make investment decisions based on information and data that is incomplete or inaccurate. Due to changes in the products or services of the companies in which the fund invests, the fund may temporarily hold securities that are inconsistent with its sustainable investment criteria.
Our investment techniques, analyses, and judgments may not produce the outcome we intend. The investments we select for the fund may not perform as well as other securities that we do not select for the fund. We, or the fund’s other service providers, may experience disruptions or operating errors that could have a negative effect on the fund. You can lose money by investing in the fund.