Current performance may be lower or higher than the quoted past performance, which cannot guarantee future results. Share price, principal value, and return will vary, and you may have a gain or loss when you sell your shares. Performance assumes reinvestment of distributions and does not account for taxes. Returns before sales charge do not reflect the current maximum sales charges as indicated below. Had the sales charge been reflected, returns would be lower. Returns at public offering price (after sales charge) for class A and class M shares reflect the current maximum initial sales charges of 5.75% and 3.50% for equity funds and 4.00% and 3.25% for income funds (2.25% for class A of Putnam Floating Rate Income Fund, Short-Term Municipal Income, Short Duration Bond Fund, and Fixed Income Absolute Return Fund), respectively. Class B share returns reflect the applicable contingent deferred sales charge (CDSC), which is 5% in the first year, declining to 1% in the sixth year, and is eliminated thereafter (except for Putnam Floating Rate Income Fund, Putnam Short Duration Bond Fund, Putnam Fixed Income Absolute Return Fund, and Putnam Short-Term Municipal Income Fund, which is 1% in the first year, declining to 0.5% in the second year, and is eliminated thereafter). Class C shares reflect a 1% CDSC the first year that is eliminated thereafter. Performance for class B, C, M, N, R, and Y shares prior to their inception is derived from the historical performance of class A shares, adjusted for the applicable sales charge (or CDSC) and, except for class Y shares, the higher operating expenses for such shares (with the exception of Putnam Tax-Free High Yield Fund and Putnam Strategic Intermediate Municipal Fund, which are based on the historical performance of class B shares). Performance for class A, C, R6, and Y shares of Putnam Mortgage Opportunities Fund before their inception is derived from the historical performance of class I shares, which have been adjusted for the applicable sales charge (or CDSC) and the higher operating expenses for such shares. Returns at public offering price (after sales charge) for class N shares reflect the current maximum initial sales charge of 1.50%. Class R5/R6 shares, available to qualified employee-benefit plans only, are sold without an initial sales charge and have no CDSC. Class Y shares are generally only available for corporate and institutional clients and have no initial sales charge. Performance for class R5/R6 shares before their inception are derived from the historical performance of class Y shares, which have not been adjusted for the lower expenses; had they, returns would have been higher. Class A shares of Putnam money market funds have no initial sales charge. For a portion of the period, some funds had expenses limitations or had been sold on a limited basis with limited assets and expenses, without which returns would be lower.
Floating Rate Income Fund (Class Y) (PFRYX)
An income fund that can benefit from higher interest rates
Highlights
Objective
The fund seeks high current income. Preservation of capital is a secondary goal.
Strategy and process
- Floating-rate bank loans: The fund primarily invests in bank loans with yields that are set at a margin above short-term interest rates and adjust when rates change.
- Guard against rising interest rates: Bank loans have historically performed well amid rising interest rates because their yields adjust higher and become more attractive.
- Backed by team research: The fund's experienced managers select a diverse range of loans using careful credit research.
Fund price |
Yesterday’s close | 52-week high | 52-week low |
---|---|---|---|
Net asset value |
$8.31
0.12% | $0.01 |
$8.48
01/17/20 |
$6.68
03/23/20 |
Fund facts as of 12/31/20
$338.76M
33%
Monthly
201
February
746763226 / 1857
10/04/05
Fixed Income
PFRYX
Management team
Literature
Fund documents |
Prospectuses/SAI |
Fact Sheet (Y share) (PDF) |
Annual Report (PDF) |
Semiannual Report (PDF) |
Alternating Bond Market Leadership (PDF) |
Quarterly commentary (PDF) |
Comparing Putnam's taxable income funds (PDF) |
Proxy voting results (Form N-PX) (PDF) |
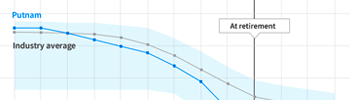
Performance
Total return (%) as of 12/31/20
Annual performance as of 12/31/20
Annualized Total return (%) as of 12/31/20
Annualized performance | 1 yr. | 3 yrs. | 5 yrs. | 10 yrs. |
---|---|---|---|---|
Before sales charge | 0.92% | 2.89% | 4.20% | 3.77% |
After sales charge | N/A | N/A | N/A | N/A |
S&P/LSTA Leveraged Loan Index | 3.12% | 4.02% | 5.24% | 4.32% |
Performance snapshot
Before sales charge | After sales charge | ||
---|---|---|---|
1 mt. as of 12/31/20 | 1.09% | - | |
YTD as of 01/15/21 | 0.99% | - | |
Yield
Distribution rate before sales charge as of 01/15/21 |
2.78% |
---|---|
Distribution rate after sales charge as of 01/15/21 |
2.78% |
30-day SEC yield as of 12/31/20 | 2.74% |
Risk-adjusted performance as of 12/31/20
Sharpe ratio (3 yrs.) | 0.18 |
---|---|
Information ratio (3 yrs.) | -0.75 |
Volatility as of 12/31/20
Standard deviation (3 yrs.) | 7.62% |
---|---|
Beta | 0.87 |
R-squared | 0.98 |
Fixed income statistics as of 12/31/20
Average effective duration | 0.14 yrs. |
---|
Lipper rankings as of 12/31/20
Time period | Rank/Funds in category | Percentile ranking |
---|---|---|
1 yr. | 156/248 | 63% |
3 yrs. | 111/230 | 49% |
5 yrs. | 87/204 | 43% |
10 yrs. | 28/96 | 29% |
Morningstar Ratings™ as of 12/31/20
Time period | Funds in category | Morningstar Rating™ |
---|---|---|
Overall | 232 | |
3 yrs. | 232 | |
5 yrs. | 207 | |
10 yrs. | 96 |
Distributions
Accrual days | 31 |
---|---|
Accrual start date | 12/01/20 |
Accrual end date | 12/31/20 |
Payable date | 12/31/20 |
Income | $0.019124923 |
Extra taxable income | -- |
Dividend frequency | Monthly |
Lipper rankings are based on total return without sales charge relative to all share classes of funds with similar objectives as determined by Lipper. Past performance is not indicative of future results.
The Morningstar RatingTM for funds, or "star rating", is calculated for managed products (including mutual funds, variable annuity and variable life subaccounts, exchange-traded funds, closed-end funds, and separate accounts) with at least a three-year history. Exchange-traded funds and open-ended mutual funds are considered a single population for comparative purposes. It is calculated based on a Morningstar Risk-Adjusted Return measure that accounts for variation in a managed product's monthly excess performance, placing more emphasis on downward variations and rewarding consistent performance. The top 10% of products in each product category receive 5 stars, the next 22.5% receive 4 stars, the next 35% receive 3 stars, the next 22.5% receive 2 stars, and the bottom 10% receive 1 star. The Overall Morningstar Rating for a managed product is derived from a weighted average of the performance figures associated with its three-, five-, and 10-year (if applicable) Morningstar Rating metrics. The weights are: 100% three-year rating for 36-59 months of total returns, 60% five-year rating/40% three-year rating for 60-119 months of total returns, and 50% 10-year rating/30% five-year rating/20% three-year rating for 120 or more months of total returns. While the 10-year overall star rating formula seems to give the most weight to the 10-year period, the most recent three-year period actually has the greatest impact because it is included in all three rating periods.
The up-market capture ratio is used to evaluate how well an investment manager performed relative to an index during periods when that index has risen. The ratio is calculated by dividing the manager’s returns by the returns of the index during the up-market, and multiplying that factor by 100. The down-market capture ratio is used to evaluate how well an investment manager performed relative to an index during periods when that index has dropped. The ratio is calculated by dividing the manager’s returns by the returns of the index during the down-market and multiplying that factor by 100.
Compare
See how this fund stacks up against its peers with FundVisualizer®
New to FundVisualizer? Watch tutorials on how to get started.
For more tutorials, please visit Advisor Tech Tips
** FundVisualizer comparison based on Putnam fund versus the largest fund in its Morningstar category.
Holdings
PG&E | 1.32% |
---|---|
Transdigm | 1.29% |
DELL Technologies | 1.25% |
Altice Numericable | 1.24% |
Charter Communications | 1.24% |
CRC Escrow Issuer LLC/CRC Finco | 1.12% |
Scientific Games | 1.10% |
Ultimate Software Group | 1.07% |
Altice USA | 1.07% |
ADT Security Services | 0.99% |
Top 10 holdings, percent of portfolio | 11.69% |
Top 10 holdings as of 12/31/20 | |
---|---|
PG&E | |
Transdigm | |
DELL Technologies | |
Altice Numericable | |
Charter Communications | |
CRC Escrow Issuer LLC/CRC Finco | |
Scientific Games | |
Ultimate Software Group | |
Altice USA | |
ADT Security Services | |
Holdings represent 11.69% of portfolio |
Top 10 holdings as of 11/30/20 | |
---|---|
PG&E | |
Transdigm | |
DELL Technologies | |
Charter Communications | |
Altice Numericable | |
CRC Escrow Issuer LLC/CRC Finco | |
Scientific Games | |
Ultimate Software Group | |
ADT Security Services | |
Altice USA | |
Holdings represent 11.82% of portfolio |
Top 10 holdings as of 10/31/20 | |
---|---|
PG&E | |
DELL Technologies | |
Transdigm | |
Charter Communications | |
Altice Numericable | |
CRC Escrow Issuer LLC/CRC Finco | |
Scientific Games | |
Ultimate Software Group | |
ADT Security Services | |
Altice USA | |
Holdings represent 12.01% of portfolio |
Top 10 holdings as of 09/30/20 | |
---|---|
PG&E | |
DELL Technologies | |
Transdigm | |
Charter Communications | |
Altice Numericable | |
CRC Escrow Issuer LLC/CRC Finco | |
Scientific Games | |
Altice USA | |
ADT Security Services | |
Gray Television | |
Holdings represent 11.71% of portfolio |
CAESARS RESORT TL L+275 02.8968 12/22/2024 | 1.12% |
---|---|
SCIENTIFIC GAMES TLB5 L+275 02.8968 08/14/2024 | 1.10% |
CSC HOLDINGS TLB L+225 02.4086 07/17/2025 | 1.07% |
POWER SOLUTIONS TLB L+350 03.6468 04/30/2026 | 0.97% |
UNIVISION TLB L+375 04.7500 03/24/2026 | 0.92% |
QUIKRETE TLB L+250 02.6468 02/01/2027 | 0.90% |
ORTHO-CLINICAL TLB L+325 03.3940 06/30/2025 | 0.88% |
BWAY CORP TLB L+325 03.4795 04/03/2024 | 0.88% |
HUB INTL TLB L+275 02.9648 04/25/2025 | 0.88% |
PLY GEM TLB L+375 03.9039 04/12/2025 | 0.87% |
DELL INTL TLB L+200 02.7500 09/19/2025 | 0.87% |
ROCKET SOFTWARE TLB L+425 04.3968 11/28/2025 | 0.86% |
ZAYO GROUP HLDG INC L+300 03.1468 03/09/2027 | 0.85% |
ALLIANT HOLD TLB L+325 3.395500 05/10/2025 | 0.84% |
PLANTRONICS TLB L+250 02.6455 07/02/2025 | 0.84% |
YUM BRANDS TLB L+175 01.9079 04/03/2025 | 0.83% |
GRAY TV TLC L+250 02.6440 11/02/2025 | 0.82% |
AIR METHODS TLB L+350 04.5000 04/21/2024 | 0.81% |
VERTIV TLB L+300 03.1440 03/02/2027 | 0.81% |
THYELE TL B 1L USD L+425 04.4283 07/31/2027 | 0.80% |
BMC TLB L+425 04.3968 10/02/2025 | 0.80% |
BEACON ROOFING TLB L+225 02.3968 01/02/2025 | 0.79% |
CLUBCORP TLB L+275 03.0039 09/18/2024 | 0.79% |
USI INC TLB L+300 03.2539 05/16/2024 | 0.79% |
WERNER TLB L+400 05.0000 07/24/2024 | 0.78% |
DIAMOND SPORTS TLB L+325 03.4000 08/24/2026 | 0.77% |
TEMPO ACQUISITION TLB L+325 03.7500 10/01/2026 | 0.77% |
NAVISTAR INTL TLB L+350 03.6600 11/06/2024 | 0.76% |
TAMKO BUILDING TLB L+325 03.3968 05/31/2026 | 0.76% |
GLOBAL MEDICAL RESPONS L+475 05.7500 10/02/2025 | 0.76% |
SFR GROUP TLB11 L+275 02.8968 07/31/2025 | 0.75% |
FOREST CITY TLB L+350 03.6468 12/07/2025 | 0.75% |
FRONTIER COMM TLB L+475 05.7500 10/08/2027 | 0.74% |
VIRGIN MEDIA TL L+250 02.6586 01/04/2028 | 0.73% |
DUN & BRADSTREET TLB L+375 03.8980 02/08/2026 | 0.73% |
ENVISION HEALTHCARE TL L+375 03.8968 10/10/2025 | 0.72% |
BASS PRO TLB L+500 05.7500 09/25/2024 | 0.72% |
GRIFOLS TLB L+200 02.1023 11/15/2027 | 0.72% |
FILTRATION GROUP TLB L+300 03.1468 03/29/2025 | 0.71% |
STAPLES TL L+500 05.2144 04/12/2026 | 0.71% |
BY CROWN PARENT LLC L+300 04.0000 01/30/2026 | 0.71% |
WEIGHT WATCHERS TLB L+475 05.5000 11/29/2024 | 0.70% |
NEXSTAR BROAD TLB L+275 02.8940 09/19/2026 | 0.70% |
BRAND ENERGY TL L+425 05.2500 06/21/2024 | 0.69% |
SOLERA TLB L+275 02.8968 03/03/2023 | 0.69% |
ATOTECH TLB1 L+300 04.0000 01/31/2024 | 0.69% |
BAUSCH HEALTH TLB L+300 03.1480 06/01/2025 | 0.69% |
ALTRA INDUSTIAL TLB L+200 02.1468 10/01/2025 | 0.68% |
PRIME SECURITY L+325 04.2500 09/23/2026 | 0.68% |
HUSKY TLB L+300 03.2666 03/28/2025 | 0.66% |
GOLDEN NUGGET TL L+250 03.2500 10/04/2023 | 0.65% |
TERRIER MEDIA TLB L+425 04.3968 12/17/2026 | 0.65% |
CLEAR CHANNEL TLB L+350 03.7144 08/21/2026 | 0.64% |
MESSER INDUST TLB L+250 02.7539 03/01/2026 | 0.64% |
ARBY'S TLB L+275 03.7500 02/05/2025 | 0.63% |
CHARTER COMM TLB2 L+175 01.9000 02/01/2027 | 0.63% |
ANCESTRY.COM 1L L+400 04.5000 11/24/2027 | 0.62% |
NEWELL BRANDS INC. 04.3500 04/01/2023 | 0.62% |
AKZONOBEL TLB L+300 03.1531 10/01/2025 | 0.62% |
PPD TL L+250 03.5000 08/18/2022 | 0.61% |
WHITE CAP TLB L+400 04.5000 10/19/2027 | 0.61% |
CREDIT SUISSE NEW YORK 02.8000 04/08/2022 | 0.61% |
CHARTER COMM OPT LLC/CAP 01.8644 02/01/2024 | 0.60% |
INTELSAT JACKSON TLB4 L+450 08.7500 01/02/2024 | 0.60% |
GENESYS TELECOMMUNICAT L+400 04.7500 10/08/2027 | 0.60% |
RACKSPACE HOSTING INC L+300 04.0000 11/03/2023 | 0.60% |
CERIDIAN TLB L+250 02.6001 04/30/2025 | 0.59% |
REFINITIV TLB L+325 03.3968 10/01/2025 | 0.59% |
GENESEE & WYOMING TL L+200 02.2539 11/05/2026 | 0.59% |
SOLENIS 1STL L+400 04.2330 06/26/2025 | 0.59% |
DIVERSEY TL L+500 06.0000 09/06/2024 | 0.58% |
BUCKEYE PARTNERS TLB L+275 02.8968 11/01/2026 | 0.58% |
ELANCO ANIMAL HLTH TLB L+175 01.8940 02/04/2027 | 0.58% |
ULTIMATE SOFTWARE TL L+375 03.8968 05/03/2026 | 0.58% |
BANIJAY GROUP TLB L+375 03.9028 03/04/2025 | 0.58% |
BLACKSTONE CQP TLB L+350 03.7358 06/20/2024 | 0.58% |
THE ADVISOR GROUP TL L+500 05.1468 08/01/2026 | 0.58% |
BERRY PLASTICS TLY L+200 02.1488 07/01/2026 | 0.58% |
SINCLAIR TV TLB2B L+250 02.6500 07/18/2026 | 0.58% |
TALLGRASS ENERGY TL L+475 04.8968 03/11/2026 | 0.58% |
VICI PROPERTIES TL L+175 01.8938 12/22/2024 | 0.55% |
ASCEND LEARNING TLB L+300 04.0000 07/12/2024 | 0.55% |
REYNOLDS TL L+175 01.8968 02/04/2027 | 0.53% |
BOYD GAMING TLB L+225 02.3523 09/15/2023 | 0.53% |
IRON MOUNTAIN TLB L+175 01.8968 01/02/2026 | 0.52% |
LIONS GATE TLB L+225 02.3968 03/24/2025 | 0.52% |
CPG INTL TL L+375 04.7500 05/05/2024 | 0.51% |
THERMON TLB L+375 04.7500 10/30/2024 | 0.51% |
SURGERY CENTER HOLDING L+325 04.2500 09/02/2024 | 0.50% |
LPL HOLDINGS TL L+175 01.8980 11/12/2026 | 0.50% |
EPICOR SOFTWARE TLB L+425 05.2500 07/30/2027 | 0.50% |
HCA INC 05.8750 05/01/2023 | 0.50% |
PACIFIC GAS & ELECTRIC 01.6993 06/16/2022 | 0.50% |
TOWNSQUARE TLB L+300 04.0000 04/01/2022 | 0.50% |
GRAHAM PACKAGING TL L+375 04.5000 08/04/2027 | 0.49% |
SFR GROUP TLB12 L+369 03.8461 01/31/2026 | 0.49% |
GATEWAY CASINO TLB L+350 04.5000 03/13/2025 | 0.49% |
VISTRA ENERGY TLB3 L+175 01.8979 12/01/2025 | 0.48% |
BJ'S WHOLESALE TLB L+200 02.1539 02/03/2024 | 0.48% |
GARDA WORLD TLB L+475 04.9900 10/30/2026 | 0.48% |
IHEARTMEDIA TLB L+300 03.1468 05/01/2026 | 0.48% |
TRIDENT TPI HLDG INC L+300 04.0000 10/05/2024 | 0.48% |
PETSMART INC TLB L+350 04.5000 03/11/2022 | 0.47% |
REYNOLDS GROUP TL L+325 03.4011 02/16/2026 | 0.47% |
TRANSDIGM INC TLE L+225 02.3968 05/30/2025 | 0.46% |
PAREXEL TLB L+275 02.8968 09/27/2024 | 0.46% |
CALPINE CONS FIN TL L+200 02.1468 01/15/2025 | 0.46% |
COMMSCOPE TLB2 L+325 03.3968 04/04/2026 | 0.45% |
ROBERTSHAW TL 2L L+800 09.0000 02/28/2026 | 0.45% |
PACIFIC GAS & L+450 05.5000 06/18/2025 | 0.44% |
WIDEOPENWEST TLB L+325 04.2500 08/19/2023 | 0.44% |
LBM ACQ LLC TLB L+375 04.5000 12/08/2027 | 0.44% |
NIELSEN FIN TLB5 L+375 04.7500 06/04/2025 | 0.44% |
PREGIS TOPCO LLC 1L L+425 05.0000 08/01/2026 | 0.44% |
ENTERCOM TLB1 L+250 02.6480 11/17/2024 | 0.44% |
UNIVAR TLB5 L+200 02.1468 11/22/2026 | 0.43% |
TRANSDIGM INC TLF L+225 02.3968 12/09/2025 | 0.43% |
GFL ENVIORNMENTAL TLB L+300 03.5000 05/31/2025 | 0.43% |
CIT GROUP INC 05.0000 08/01/2023 | 0.42% |
PQ CORP TLB L+225 02.4644 02/07/2027 | 0.41% |
ULTIMATE SOFTWARE L+400 04.7500 05/03/2026 | 0.41% |
RESTAURANT BRANDS TLB L+175 01.8968 11/19/2026 | 0.39% |
TRANSDIGM INC. P/P 144A 06.2500 03/15/2026 | 0.39% |
STARS GROUP TLB L+350 03.7539 07/10/2025 | 0.39% |
AMERICAN BATH 1L L+450 05.2500 11/23/2027 | 0.38% |
TTM TECH INC TL L+250 02.6378 09/28/2024 | 0.38% |
DIAMOND 1 FIN/DIAMON P/P 144A 07.1250 06/15/2024 | 0.38% |
DIVERSEY TL L+300 03.2144 09/06/2024 | 0.37% |
GARDNER DENVER TLB L+175 01.8968 02/28/2027 | 0.37% |
PACIFIC GAS & ELECTRIC 01.7500 06/16/2022 | 0.36% |
EXTENDED STAY TLB L+200 02.1468 09/18/2026 | 0.36% |
GLP CAPITAL LP / FIN II 05.3750 11/01/2023 | 0.36% |
ZOETIS INC 00.6638 08/20/2021 | 0.36% |
WESTERN DIGITAL TLB L+175 01.8968 04/29/2023 | 0.34% |
SS&C TECH TLB3 L+175 01.8968 04/16/2025 | 0.33% |
NETFLIX INC 05.7500 03/01/2024 | 0.33% |
GREAT LAKES D&D 08.0000 05/15/2022 | 0.33% |
ASURION TLB6 L+300 03.1468 11/03/2023 | 0.33% |
BOEING CO 04.5080 05/01/2023 | 0.32% |
LENNAR CORP 04.7500 11/15/2022 | 0.32% |
IHEARTCOMMUNICATI L+400 04.7500 05/01/2026 | 0.31% |
SPRINT CORP 07.2500 09/15/2021 | 0.31% |
DELTA AIR LINE SKY L+375 04.7500 10/20/2027 | 0.31% |
MARRIOTT INTERNATIONAL 03.1250 02/15/2023 | 0.30% |
TEVA PHARMACEUTICALS NE USD 02.2000 07/21/2021 | 0.30% |
COMMSCOPE INC P/P 144A 05.5000 03/01/2024 | 0.30% |
POMEGRANATE MERGER S P/P 144A 09.7500 05/01/2023 | 0.30% |
ALBERTSONS COS P/P 144A 03.5000 02/15/2023 | 0.30% |
GATES GLOBAL TLB L+275 03.7500 03/31/2024 | 0.30% |
THE ADT SECURITY CORPORATION 03.5000 07/15/2022 | 0.30% |
ICAHN ENTERPRISES/FI 06.2500 02/01/2022 | 0.30% |
SABRE GLBL INC TLB L+400 04.7500 12/10/2027 | 0.30% |
T-MOBILE USA INC 06.0000 03/01/2023 | 0.30% |
EW SCRIPPS TLB L+300 03.7500 12/15/2027 | 0.30% |
PRETIUM PKG HLDG INC L+400 04.7500 10/29/2027 | 0.30% |
MOTORCITY TLB L+375 04.5000 11/04/2025 | 0.29% |
GARDNER DENVER INC TLB L+275 02.8968 03/01/2027 | 0.29% |
MATCH TLB L+175 01.9636 02/13/2027 | 0.29% |
MEREDITH TLB L+250 02.6468 01/31/2025 | 0.29% |
SS&C TECH TLB5 L+175 01.8968 04/16/2025 | 0.28% |
LEVEL 3 TLB L+175 01.8968 03/01/2027 | 0.28% |
AMERICAN AXLE & MANUF L+225 03.0000 04/06/2024 | 0.28% |
TENET HEALTHCARE 04.6250 07/15/2024 | 0.27% |
EPICOR SOFTWARE 2NDL L+775 08.7500 07/30/2028 | 0.26% |
SS&C TECH TLB4 L+175 01.8968 04/16/2025 | 0.26% |
SOTERA HEALTH TL L+450 05.5000 12/13/2026 | 0.25% |
MGM RESORTS INTL 06.0000 03/15/2023 | 0.24% |
ROBERTSHAW US HOLDING L+350 04.5000 02/28/2025 | 0.24% |
FORD MOTOR CREDIT CO LLC 05.5840 03/18/2024 | 0.24% |
STAPLES INC P/P 144A 07.5000 04/15/2026 | 0.24% |
REYNOLDS GROUP TL L+275 02.8968 02/05/2023 | 0.24% |
THE GAP INC. P/P 144A 08.3750 05/15/2023 | 0.23% |
BAUSCH HLTH COS INC P/P 144A 07.0000 03/15/2024 | 0.22% |
CHAMPIONX HLDG INC TLB L+500 06.0000 06/03/2027 | 0.22% |
LIONS GATE CAP HOLD P/P 144A 06.3750 02/01/2024 | 0.21% |
MEREDITH TLB L+425 05.2500 01/31/2025 | 0.21% |
APERGY TLB L+250 02.6875 05/09/2025 | 0.20% |
MEREDITH CORP P/P 144A 06.5000 07/01/2025 | 0.19% |
CARNIVAL CORP P/P 144A 11.5000 04/01/2023 | 0.17% |
1011778 BC / NEW RED P/P 144A 04.2500 05/15/2024 | 0.16% |
VIDEOTRON LTD USD 05.0000 07/15/2022 | 0.16% |
SOLERA LLC / SOLERA P/P 144A 10.5000 03/01/2024 | 0.15% |
CARNIVAL CORP TLB L+750 08.5000 06/30/2025 | 0.15% |
LADDER CAP FIN LLLP P/P 144A 05.2500 03/15/2022 | 0.15% |
ASPLUNDH TLB L+250 02.6468 09/04/2027 | 0.15% |
TERRIER MEDIA TLB L+425 04.3968 12/17/2026 | 0.15% |
WASTEQUIP TLB L+350 04.5000 03/20/2025 | 0.14% |
SOLENIS 2NDL L+850 08.7330 06/26/2026 | 0.13% |
AMERICAN BATH 1L2 L+450 05.2500 11/23/2027 | 0.13% |
FORD MOTOR CREDIT CO LLC 01.2958 08/03/2022 | 0.11% |
LBM AQUISITION DD L+375 04.5000 12/10/2027 | 0.10% |
QUORUM HEALTH EXT TL L+825 09.2500 04/29/2025 | 0.09% |
CLEAR CHANNEL OUTDOOR HOLDIN SEDOL BJHVCH9 | 0.09% |
ULTIMATE SOFTWARE 2L L+675 07.5000 05/03/2027 | 0.08% |
INSPIRE BRANDS TLB L+325 04.2500 11/19/2027 | 0.07% |
GOLDEN NUGGET TL L+1200 13.0000 10/04/2023 | 0.06% |
ROYAL CARIBBEAN P/P 144A 09.1250 06/15/2023 | 0.04% |
TXU TCEH RIGHTS | 0.03% |
TRIBUNE CLASS 1C LITIGAT | 0.02% |
CHC GROUP LLC SEDOL BYXD3K4 | 0.00% |
CAESARS RESORT TL L+275 02.8955 12/22/2024 | 1.12% |
---|---|
SCIENTIFIC GAMES TLB5 L+275 02.8955 08/14/2024 | 1.10% |
CSC HOLDINGS TLB L+225 02.3892 07/17/2025 | 1.06% |
POWER SOLUTIONS TLB L+350 03.6455 04/30/2026 | 0.97% |
ZAYO GROUP HLDG INC L+300 03.1455 03/09/2027 | 0.95% |
UNIVISION TLB L+375 04.7500 03/24/2026 | 0.92% |
QUIKRETE TLB L+250 04.1594 02/01/2027 | 0.90% |
ORTHO-CLINICAL TLB L+325 03.3903 06/30/2025 | 0.89% |
DELL INTL TLB L+200 02.7500 09/19/2025 | 0.88% |
HUB INTL TLB L+275 02.9647 04/25/2025 | 0.88% |
BWAY CORP TLB L+325 03.4795 04/03/2024 | 0.88% |
PLY GEM TLB L+375 03.8799 04/12/2025 | 0.87% |
ROCKET SOFTWARE TLB L+425 04.3955 11/28/2025 | 0.87% |
ALLIANT HOLD TLB L+300 03.3955 05/10/2025 | 0.85% |
PLANTRONICS TLB L+250 02.6455 07/02/2025 | 0.84% |
YUM BRANDS TLB L+175 01.8935 04/03/2025 | 0.83% |
GRAY TV TLC L+250 02.6548 11/02/2025 | 0.82% |
VERTIV TLB L+300 03.1534 03/02/2027 | 0.81% |
THYELE TL B 1L USD L+425 04.4283 06/30/2027 | 0.81% |
BMC TLB L+425 04.3955 10/02/2025 | 0.80% |
AIR METHODS TLB L+350 04.5000 04/21/2024 | 0.79% |
BEACON ROOFING TLB L+225 02.3955 01/02/2025 | 0.79% |
USI INC TLB L+300 03.2204 05/16/2024 | 0.79% |
WERNER TLB L+400 05.0000 07/24/2024 | 0.78% |
NAVISTAR INTL TLB L+350 03.6500 11/06/2024 | 0.77% |
CLUBCORP TLB L+275 02.9704 09/18/2024 | 0.77% |
TEMPO ACQUISITION TLB L+325 03.7500 10/01/2026 | 0.77% |
TAMKO BUILDING TLB L+325 03.3955 05/31/2026 | 0.76% |
GLOBAL MEDICAL RESPONS L+475 05.7500 10/02/2025 | 0.76% |
FOREST CITY TLB L+350 03.6455 12/07/2025 | 0.76% |
SFR GROUP SA TLB L+275 02.8955 07/31/2025 | 0.75% |
PRIME SECURITY L+325 04.2500 09/23/2026 | 0.75% |
FRONTIER COMM TLB L+475 06.0000 10/08/2027 | 0.75% |
DIAMOND SPORTS TLB L+325 03.4000 08/24/2026 | 0.74% |
DUN & BRADSTREET TLB L+375 03.8930 02/08/2026 | 0.73% |
VIRGIN MEDIA TL L+250 02.6409 01/04/2028 | 0.73% |
BAUSCH HEALTH TLB L+300 03.1430 06/01/2025 | 0.73% |
BASS PRO TLB L+500 05.7500 09/25/2024 | 0.72% |
GRIFOLS TLB L+200 02.0951 11/15/2027 | 0.72% |
ENVISION HEALTHCARE TL L+375 03.8955 10/10/2025 | 0.72% |
STAPLES TL L+500 05.2144 04/12/2026 | 0.71% |
FILTRATION GROUP TLB L+300 03.1455 03/29/2025 | 0.71% |
WEIGHT WATCHERS TLB L+475 05.5000 11/29/2024 | 0.71% |
BY CROWN PARENT LLC L+300 04.0000 01/30/2026 | 0.71% |
NEXSTAR BROAD TLB L+275 02.9048 09/19/2026 | 0.70% |
ALTRA INDUSTIAL TLB L+200 02.1455 10/01/2025 | 0.70% |
SOLERA TLB L+275 02.8955 03/03/2023 | 0.70% |
ATOTECH TLB1 L+300 04.0000 01/31/2024 | 0.69% |
BRAND ENERGY TL L+425 05.2500 06/21/2024 | 0.69% |
GFL ENVIRONMENTAL TLB L+300 04.0000 05/31/2025 | 0.68% |
HUSKY TLB L+300 03.3614 03/28/2025 | 0.66% |
GOLDEN NUGGET TL L+250 03.2500 10/04/2023 | 0.65% |
TERRIER MEDIA TLB L+425 04.3955 12/17/2026 | 0.65% |
MESSER INDUST TLB L+250 02.7204 03/01/2026 | 0.64% |
CLEAR CHANNEL TLB L+350 03.7143 08/21/2026 | 0.64% |
CHARTER COMM TLB2 L+175 01.9000 02/01/2027 | 0.63% |
ARBY'S TLB L+275 03.7500 02/05/2025 | 0.63% |
NEWELL BRANDS INC. 04.3500 04/01/2023 | 0.63% |
ANCESTRY.COM 1L L+400 04.5000 11/24/2027 | 0.62% |
PPD TL L+250 03.5000 08/18/2022 | 0.62% |
AKZONOBEL TLB L+300 03.1409 10/01/2025 | 0.62% |
CREDIT SUISSE NEW YORK 02.8000 04/08/2022 | 0.62% |
CHARTER COMM OPT LLC/CAP 01.8644 02/01/2024 | 0.61% |
WHITE CAP TLB L+400 04.5000 10/19/2027 | 0.61% |
INTELSAT JACKSON TLB4 L+450 08.7500 01/02/2024 | 0.60% |
RACKSPACE HOSTING INC L+300 04.0000 11/03/2023 | 0.60% |
GENESYS TELECOMMUNICAT L+400 04.7500 10/08/2027 | 0.60% |
CERIDIAN TLB L+250 02.5951 04/30/2025 | 0.60% |
REFINITIV TLB L+325 03.3955 10/01/2025 | 0.60% |
DIVERSEY TL L+500 06.0000 09/06/2024 | 0.60% |
GENESEE & WYOMING TL L+200 02.2204 11/05/2026 | 0.59% |
SOLENIS 1STL L+400 04.2328 06/26/2025 | 0.59% |
BUCKEYE PARTNERS TLB L+275 02.9048 11/01/2026 | 0.59% |
ELANCO ANIMAL HLTH TLB L+175 01.9048 02/04/2027 | 0.59% |
ULTIMATE SOFTWARE TL L+375 03.8955 05/03/2026 | 0.59% |
BLACKSTONE CQP TLB L+350 03.7254 06/20/2024 | 0.58% |
BANIJAY GROUP TLB L+375 03.8876 03/04/2025 | 0.58% |
BERRY PLASTICS TLY L+200 02.1278 07/01/2026 | 0.58% |
SINCLAIR TV TLB2B L+250 02.6500 07/18/2026 | 0.58% |
PQ CORP TLB L+225 02.4644 02/07/2027 | 0.57% |
THE ADVISOR GROUP TL L+500 05.1455 08/01/2026 | 0.57% |
TALLGRASS ENERGY TL L+475 04.8955 03/11/2026 | 0.56% |
ASCEND LEARNING TLB L+300 04.0000 07/12/2024 | 0.55% |
VICI PROPERTIES TL L+175 01.8955 12/22/2024 | 0.55% |
REYNOLDS TL L+175 01.8955 02/04/2027 | 0.54% |
BOYD GAMING TLB L+225 02.3451 09/15/2023 | 0.53% |
IRON MOUNTAIN TLB L+175 01.8955 01/02/2026 | 0.52% |
LIONS GATE TLB L+225 02.3968 03/24/2025 | 0.52% |
CPG INTL TL L+375 04.7500 05/05/2024 | 0.52% |
THERMON TLB L+375 04.7500 10/30/2024 | 0.51% |
SURGERY CENTER HOLDING L+325 04.2500 09/02/2024 | 0.51% |
EPICOR SOFTWARE TLB L+425 05.2500 07/30/2027 | 0.51% |
PACIFIC GAS & ELECTRIC 01.7173 06/16/2022 | 0.51% |
GRAHAM PACKAGING TL L+375 04.5000 08/04/2027 | 0.51% |
HCA INC 05.8750 05/01/2023 | 0.51% |
LPL HOLDINGS TL L+175 01.8930 11/12/2026 | 0.50% |
SFR GROUP TLB12 L+369 03.8284 01/31/2026 | 0.49% |
TOWNSQUARE TLB L+300 04.0000 04/01/2022 | 0.49% |
ASURION TLB6 L+300 03.1455 11/03/2023 | 0.49% |
BJ'S WHOLESALE TLB L+200 02.1401 02/03/2024 | 0.49% |
VISTRA ENERGY TLB3 L+175 01.8937 12/01/2025 | 0.49% |
GATEWAY CASINO TLB L+350 04.5000 03/13/2025 | 0.48% |
GARDA WORLD TLB L+475 04.9100 10/30/2026 | 0.48% |
TRIDENT TPI HLDG INC L+325 04.0000 10/05/2024 | 0.48% |
IHEARTMEDIA TLB L+300 03.1455 05/01/2026 | 0.48% |
PETSMART INC TLB L+300 04.5000 03/11/2022 | 0.47% |
REYNOLDS GROUP TL L+325 03.4011 02/16/2026 | 0.47% |
CALPINE CONS FIN TL L+200 02.1455 01/15/2025 | 0.46% |
PAREXEL TLB L+275 02.8955 09/27/2024 | 0.46% |
TRANSDIGM INC TLE L+225 02.3955 05/30/2025 | 0.46% |
COMMSCOPE TLB2 L+325 03.3955 04/04/2026 | 0.45% |
PACIFIC GAS & L+450 05.5000 06/18/2025 | 0.45% |
NIELSEN FINANCE LLC L+375 04.7500 06/04/2025 | 0.45% |
WIDEOPENWEST TLB L+325 04.2500 08/19/2023 | 0.45% |
ENTERCOM TLB1 L+250 02.6433 11/17/2024 | 0.44% |
UNIVAR TLB5 L+200 02.1455 11/22/2026 | 0.44% |
ROBERTSHAW TL 2L L+800 09.0000 02/28/2026 | 0.43% |
TRANSDIGM INC TLF L+225 02.3955 12/09/2025 | 0.43% |
CIT GROUP INC 05.0000 08/01/2023 | 0.42% |
ULTIMATE SOFTWARE L+400 04.7500 05/03/2026 | 0.41% |
TRANSDIGM INC. P/P 144A 06.2500 03/15/2026 | 0.40% |
RESTAURANT BRANDS TLB L+175 01.8955 11/19/2026 | 0.39% |
STARS GROUP TLB L+350 03.7204 07/10/2025 | 0.39% |
AMERICAN BATH 1L L+450 05.2500 11/19/2027 | 0.39% |
DIAMOND 1 FIN/DIAMON P/P 144A 07.1250 06/15/2024 | 0.39% |
TTM TECH INC TL L+250 02.6548 09/28/2024 | 0.38% |
DIVERSEY TL L+300 03.2142 09/06/2024 | 0.38% |
GARDNER DENVER TLB L+175 01.8955 02/28/2027 | 0.37% |
GATES GLOBAL TLB L+275 03.7500 03/31/2024 | 0.37% |
PACIFIC GAS & ELECTRIC 01.7500 06/16/2022 | 0.37% |
EXTENDED STAY TLB L+200 02.1455 09/18/2026 | 0.36% |
ZOETIS INC 00.6638 08/20/2021 | 0.36% |
GLP CAPITAL LP / FIN II 05.3750 11/01/2023 | 0.35% |
SS&C TECH TLB3 L+175 01.8955 04/16/2025 | 0.35% |
WESTERN DIGITAL TLB L+175 01.8955 04/29/2023 | 0.34% |
NETFLIX INC 05.7500 03/01/2024 | 0.34% |
GREAT LAKES D&D 08.0000 05/15/2022 | 0.33% |
LENNAR CORP 04.7500 11/15/2022 | 0.33% |
IHEARTCOMMUNICATI L+400 04.7500 05/01/2026 | 0.32% |
BOEING CO 04.5080 05/01/2023 | 0.32% |
SPRINT CORP 07.2500 09/15/2021 | 0.31% |
TEVA PHARMACEUTICALS NE USD 02.2000 07/21/2021 | 0.31% |
MARRIOTT INTERNATIONAL 03.1250 02/15/2023 | 0.31% |
AMERICAN AXLE & MANUF L+225 03.0000 04/06/2024 | 0.31% |
COMMSCOPE INC P/P 144A 05.5000 03/01/2024 | 0.31% |
ALBERTSONS COS P/P 144A 03.5000 02/15/2023 | 0.31% |
DELTA AIR LINE SKY L+375 04.7500 10/20/2027 | 0.30% |
THE ADT SECURITY CORPORATION 03.5000 07/15/2022 | 0.30% |
ICAHN ENTERPRISES/FI 06.2500 02/01/2022 | 0.30% |
T-MOBILE USA INC 06.0000 03/01/2023 | 0.30% |
PRETIUM PKG HLDG INC L+400 04.7500 10/29/2027 | 0.30% |
MOTORCITY TLB L+375 04.5000 10/29/2025 | 0.30% |
MATCH TLB L+175 01.9636 02/13/2027 | 0.29% |
TALLGRASS NRG PRTNR P/P 144A 04.7500 10/01/2023 | 0.29% |
POMEGRANATE MERGER S P/P 144A 09.7500 05/01/2023 | 0.29% |
MEREDITH TLB L+250 02.6455 01/31/2025 | 0.29% |
SS&C TECH TLB5 L+175 01.8955 04/16/2025 | 0.29% |
LEVEL 3 TLB L+175 01.8955 03/01/2027 | 0.28% |
TENET HEALTHCARE 04.6250 07/15/2024 | 0.27% |
SS&C TECH TLB4 L+175 01.8955 04/16/2025 | 0.27% |
APERGY TLB L+250 02.6875 05/09/2025 | 0.27% |
CHS/COMMUNITY HEALTH SYS 06.2500 03/31/2023 | 0.26% |
EPICOR SOFTWARE 2NDL L+775 08.7500 07/30/2028 | 0.26% |
SOTERA HEALTH TL L+450 05.5000 12/13/2026 | 0.25% |
ROBERTSHAW US HOLDING L+325 04.5000 02/28/2025 | 0.25% |
MGM RESORTS INTL 06.0000 03/15/2023 | 0.25% |
FORD MOTOR CREDIT CO LLC 05.5840 03/18/2024 | 0.24% |
REYNOLDS GROUP TL L+300 02.8955 02/05/2023 | 0.24% |
THE GAP INC. P/P 144A 08.3750 05/15/2023 | 0.23% |
STAPLES INC P/P 144A 07.5000 04/15/2026 | 0.23% |
CHAMPIONX HLDG INC TLB L+500 06.0000 06/03/2027 | 0.22% |
BAUSCH HLTH COS INC P/P 144A 07.0000 03/15/2024 | 0.22% |
LIONS GATE CAP HOLD P/P 144A 06.3750 02/01/2024 | 0.21% |
MEREDITH TLB L+425 05.2500 01/31/2025 | 0.21% |
MEREDITH CORP P/P 144A 06.5000 07/01/2025 | 0.19% |
CARNIVAL CORP P/P 144A 11.5000 04/01/2023 | 0.17% |
1011778 BC / NEW RED P/P 144A 04.2500 05/15/2024 | 0.16% |
VIDEOTRON LTD USD 05.0000 07/15/2022 | 0.16% |
SOLERA LLC / SOLERA P/P 144A 10.5000 03/01/2024 | 0.16% |
CARNIVAL CORP TLB L+750 08.5000 06/30/2025 | 0.15% |
ASPLUNDH TLB L+250 02.6376 09/04/2027 | 0.15% |
LADDER CAP FIN LLLP P/P 144A 05.2500 03/15/2022 | 0.15% |
TERRIER MEDIA TLB L+425 04.3955 12/17/2026 | 0.15% |
WASTEQUIP TLB L+350 04.5000 03/20/2025 | 0.14% |
AMERICAN BATH 1L2 L+450 05.2500 11/19/2027 | 0.13% |
SOLENIS 2NDL L+850 08.7330 06/26/2026 | 0.13% |
FORD MOTOR CREDIT CO LLC 01.2958 08/03/2022 | 0.11% |
CLEAR CHANNEL OUTDOOR HOLDIN SEDOL BJHVCH9 | 0.08% |
ULTIMATE SOFTWARE 2L L+675 07.5000 05/03/2027 | 0.08% |
INSPIRE BRANDS TLB L+325 04.2500 11/19/2027 | 0.07% |
GOLDEN NUGGET TL L+1200 13.0000 10/04/2023 | 0.06% |
ROYAL CARIBBEAN P/P 144A 09.1250 06/15/2023 | 0.04% |
TXU TCEH RIGHTS | 0.03% |
TRIBUNE CLASS 1C LITIGAT | 0.02% |
CHC GROUP LLC SEDOL BYXD3K4 | 0.01% |
CAESARS RESORT TL L+275 02.8978 12/22/2024 | 1.12% |
---|---|
SCIENTIFIC GAMES TLB5 L+275 02.8978 08/14/2024 | 1.10% |
CSC HOLDINGS TLB L+225 02.3984 07/17/2025 | 1.08% |
POWER SOLUTIONS TLB L+350 05.7344 04/30/2026 | 0.98% |
ZAYO GROUP HLDG INC L+300 04.6678 03/09/2027 | 0.96% |
UNIVISION TLB L+375 04.7500 03/24/2026 | 0.93% |
QUIKRETE TLB L+250 04.1594 02/01/2027 | 0.93% |
ORTHO-CLINICAL TLB L+325 03.3903 06/30/2025 | 0.91% |
DELL INTL TLB L+200 04.0500 09/19/2025 | 0.90% |
HUB INTL TLB L+300 03.2147 04/25/2025 | 0.89% |
PLY GEM TLB L+375 03.8953 04/12/2025 | 0.89% |
BWAY CORP TLB L+325 03.4795 04/03/2024 | 0.89% |
ROCKET SOFTWARE TLB L+425 06.7452 11/20/2025 | 0.88% |
ALLIANT HOLD TLB L+275 02.8978 05/10/2025 | 0.86% |
PLANTRONICS TLB L+250 02.6478 07/02/2025 | 0.86% |
YUM BRANDS TLB L+175 01.8973 04/03/2025 | 0.85% |
GRAY TV TLC L+250 02.6491 11/02/2025 | 0.84% |
VERTIV TLB L+300 04.6550 03/02/2027 | 0.83% |
THYELE TL B 1L USD L+425 04.4283 06/30/2027 | 0.82% |
BMC TLB L+425 04.3978 10/02/2025 | 0.81% |
BEACON ROOFING TLB L+225 02.3978 01/02/2025 | 0.81% |
USI INC TLB L+300 03.2204 05/16/2024 | 0.80% |
NAVISTAR INTL TLB L+350 03.6500 11/06/2024 | 0.79% |
NEXSTAR BROAD TLB L+275 04.8070 09/19/2026 | 0.79% |
FOREST CITY TLB L+350 03.6478 12/07/2025 | 0.79% |
WERNER TLB L+400 05.0000 07/24/2024 | 0.78% |
TAMKO BUILDING TLB L+325 05.5640 05/31/2026 | 0.78% |
TEMPO ACQUISITION TLB L+325 03.7500 10/01/2026 | 0.78% |
GLOBAL MEDICAL RESPONS L+475 05.5000 10/05/2025 | 0.77% |
PRIME SECURITY L+325 04.2500 09/23/2026 | 0.77% |
SFR GROUP SA TLB L+275 02.8978 07/31/2025 | 0.76% |
FRONTIER COMM TLB L+475 06.0000 10/01/2027 | 0.76% |
DUN & BRADSTREET TLB L+400 07.2411 02/08/2026 | 0.75% |
AIR METHODS TLB L+350 04.5000 04/21/2024 | 0.75% |
CLUBCORP TLB L+275 02.9704 09/18/2024 | 0.74% |
BASS PRO TLB L+500 05.7500 09/25/2024 | 0.74% |
BAUSCH HEALTH TLB L+300 05.4809 06/01/2025 | 0.74% |
VIRGIN MEDIA TL L+250 02.6484 01/04/2028 | 0.74% |
GRIFOLS TLB L+200 03.7996 11/15/2027 | 0.74% |
WEIGHT WATCHERS TLB L+475 05.5000 11/29/2024 | 0.73% |
FILTRATION GROUP TLB L+300 03.1478 03/29/2025 | 0.73% |
ALTRA INDUSTIAL TLB L+200 02.1478 10/01/2025 | 0.73% |
BY CROWN PARENT LLC L+300 04.0000 01/30/2026 | 0.72% |
BJ'S WHOLESALE TLB L+200 02.1453 02/03/2024 | 0.72% |
ATOTECH TLB1 L+300 04.0000 01/31/2024 | 0.71% |
SOLERA TLB L+275 02.9164 03/03/2023 | 0.71% |
STAPLES TL L+500 05.2144 04/12/2026 | 0.70% |
GFL ENVIRONMENTAL TLB L+300 04.0000 05/31/2025 | 0.69% |
BRAND ENERGY TL L+425 05.2500 06/21/2024 | 0.69% |
HUSKY TLB L+300 03.3614 03/28/2025 | 0.67% |
TERRIER MEDIA TLB L+425 05.9898 12/17/2026 | 0.66% |
MESSER INDUST TLB L+250 02.7204 03/01/2026 | 0.65% |
CHARTER COMM TLB2 L+175 03.6391 02/01/2027 | 0.64% |
ENVISION HEALTHCARE TL L+375 03.8978 10/10/2025 | 0.64% |
NEWELL BRANDS INC. 04.3500 04/01/2023 | 0.64% |
PPD TL L+250 03.5000 08/18/2022 | 0.64% |
CLEAR CHANNEL TLB L+350 05.5435 08/21/2026 | 0.64% |
CREDIT SUISSE NEW YORK 02.8000 04/08/2022 | 0.64% |
AKZONOBEL TLB L+300 03.1453 10/01/2025 | 0.63% |
ARBY'S TLB L+275 04.4095 02/05/2025 | 0.63% |
CHARTER COMM OPT LLC/CAP 01.8644 02/01/2024 | 0.63% |
WHITE CAP TLB L+400 04.5000 10/08/2027 | 0.63% |
INTELSAT JACKSON TLB4 L+550 08.7500 01/02/2024 | 0.62% |
GOLDEN NUGGET TL L+250 04.0811 10/04/2023 | 0.62% |
DIVERSEY TL L+500 06.0000 09/06/2024 | 0.61% |
GENESYS TELECOMMUNICAT L+400 04.7500 10/08/2027 | 0.61% |
RACKSPACE HOSTING INC L+300 04.0000 11/03/2023 | 0.61% |
REFINITIV TLB L+325 03.3978 10/01/2025 | 0.61% |
CERIDIAN TLB L+250 02.5938 04/30/2025 | 0.61% |
GENESEE & WYOMING TL L+200 03.7743 11/05/2026 | 0.60% |
SOLENIS 1STL L+400 04.2559 06/26/2025 | 0.60% |
ELANCO ANIMAL HLTH TLB L+175 03.4044 02/04/2027 | 0.60% |
BUCKEYE PARTNERS TLB L+275 04.9443 11/01/2026 | 0.60% |
ULTIMATE SOFTWARE TL L+375 03.8978 05/03/2026 | 0.60% |
BANIJAY GROUP TLB L+375 05.4044 03/04/2025 | 0.60% |
BLACKSTONE CQP TLB L+350 05.8866 06/20/2024 | 0.59% |
SINCLAIR TV TLB2B L+250 02.6500 07/18/2026 | 0.59% |
PQ CORP TLB L+225 03.6268 02/07/2027 | 0.59% |
THE ADVISOR GROUP TL L+500 07.1444 08/01/2026 | 0.59% |
BERRY PLASTICS TLY L+200 03.8985 07/01/2026 | 0.58% |
REYNOLDS TL 341 03.4095 02/04/2027 | 0.58% |
DIAMOND SPORTS TLB L+325 03.4000 08/24/2026 | 0.56% |
ASCEND LEARNING TLB L+300 04.0000 07/12/2024 | 0.56% |
VICI PROPERTIES TL L+175 01.8958 12/22/2024 | 0.56% |
TALLGRASS ENERGY TL L+475 04.8978 03/11/2026 | 0.55% |
BOYD GAMING TLB L+225 02.3438 09/15/2023 | 0.54% |
CPG INTL TL L+375 04.7500 05/05/2024 | 0.53% |
LIONS GATE TLB L+225 02.3978 03/24/2025 | 0.53% |
IRON MOUNTAIN TLB L+175 01.8978 01/02/2026 | 0.53% |
THERMON TLB L+375 04.7500 10/30/2024 | 0.52% |
PACIFIC GAS & ELECTRIC 01.7173 06/16/2022 | 0.52% |
EPICOR SOFTWARE TLB L+425 05.2500 07/30/2027 | 0.52% |
HCA INC 05.8750 05/01/2023 | 0.52% |
GRAHAM PACKAGING TL L+375 04.0183 08/04/2027 | 0.52% |
LPL HOLDINGS TL L+175 03.6405 11/12/2026 | 0.51% |
TOWNSQUARE TLB L+300 04.0000 04/01/2022 | 0.51% |
SURGERY CENTER HOLDING L+398 04.5739 09/02/2024 | 0.51% |
ASURION TLB6 L+300 03.1478 11/03/2023 | 0.50% |
SFR GROUP TLB12 L+369 03.8359 01/31/2026 | 0.50% |
VISTRA ENERGY TLB3 L+175 01.8977 12/01/2025 | 0.50% |
GARDA WORLD TLB L+475 06.6903 10/30/2026 | 0.49% |
TRIDENT TPI HLDG INC L+300 04.0000 10/05/2024 | 0.48% |
REYNOLDS GROUP TL L+325 03.4011 02/16/2026 | 0.48% |
GATEWAY CASINO TLB L+350 04.5000 03/13/2025 | 0.48% |
IHEARTMEDIA TLB L+300 04.6595 05/01/2026 | 0.48% |
CALPINE CONS FIN TL L+200 02.1478 01/15/2025 | 0.47% |
PAREXEL TLB L+275 02.8978 09/27/2024 | 0.46% |
TRANSDIGM INC TLE L+225 05/30/2025 | 0.46% |
NIELSEN FINANCE LLC L+375 05.0000 06/04/2025 | 0.46% |
PACIFIC GAS & L+450 05.5000 06/18/2025 | 0.46% |
WIDEOPENWEST TLB L+325 04.2500 08/19/2023 | 0.46% |
COMMSCOPE TLB2 L+325 03.3978 04/04/2026 | 0.45% |
ENTERCOM TLB1 L+250 04.2101 11/17/2024 | 0.45% |
UNIVAR TLB5 L+200 02.1478 11/22/2026 | 0.44% |
TRANSDIGM INC TLF L+225 03.9094 12/09/2025 | 0.43% |
CIT GROUP INC 05.0000 08/01/2023 | 0.43% |
ULTIMATE SOFTWARE L+400 04.7500 05/03/2026 | 0.42% |
STARS GROUP TLB L+350 03.7204 07/10/2025 | 0.40% |
RESTAURANT BRANDS TLB L+175 03.5080 11/19/2026 | 0.40% |
TRANSDIGM INC. P/P 144A 06.2500 03/15/2026 | 0.40% |
DIAMOND 1 FIN/DIAMON P/P 144A 07.1250 06/15/2024 | 0.40% |
TTM TECH INC TL L+250 02.6472 09/28/2024 | 0.40% |
SS&C TECH TLB3 L+175 03.4119 04/16/2025 | 0.39% |
WESTERN DIGITAL TLB L+175 01.8978 04/29/2023 | 0.39% |
PETSMART INC TLB L+400 04.5000 03/11/2022 | 0.38% |
GARDNER DENVER TLB L+175 03.4109 02/28/2027 | 0.38% |
GATES GLOBAL TLB L+275 03.7500 03/31/2024 | 0.38% |
ACADEMY SPORTS TLB L+300 06.2500 07/02/2022 | 0.38% |
PACIFIC GAS & ELECTRIC 01.7500 06/16/2022 | 0.38% |
DIVERSEY TL L+300 03.2142 09/06/2024 | 0.38% |
ZOETIS INC 00.6930 08/20/2021 | 0.37% |
EXTENDED STAY TLB L+200 02.1478 09/18/2026 | 0.37% |
GLP CAPITAL LP / FIN II 05.3750 11/01/2023 | 0.36% |
ROBERTSHAW TL 2L L+800 09.0000 02/28/2026 | 0.36% |
TALBOTS TLB L+700 07.2204 11/28/2022 | 0.34% |
GREAT LAKES D&D 08.0000 05/15/2022 | 0.34% |
NETFLIX INC 05.7500 03/01/2024 | 0.34% |
LENNAR CORP 04.7500 11/15/2022 | 0.33% |
BOEING CO 04.5080 05/01/2023 | 0.33% |
IHEARTCOMMUNICATI L+400 04.7500 05/01/2026 | 0.32% |
SPRINT CORP 07.2500 09/15/2021 | 0.32% |
MARRIOTT INTERNATIONAL 03.1250 02/15/2023 | 0.32% |
1011778 BC / NEW RED P/P 144A 04.2500 05/15/2024 | 0.31% |
COMMSCOPE INC P/P 144A 05.5000 03/01/2024 | 0.31% |
TEVA PHARMACEUTICALS NE USD 02.2000 07/21/2021 | 0.31% |
THE ADT SECURITY CORPORATION 03.5000 07/15/2022 | 0.31% |
ALBERTSONS COS P/P 144A 03.5000 02/15/2023 | 0.31% |
AMERICAN AXLE & MANUF L+273 03.4062 04/06/2024 | 0.31% |
ICAHN ENTERPRISES/FI 06.2500 02/01/2022 | 0.31% |
T-MOBILE USA INC 06.0000 03/01/2023 | 0.31% |
DELTA AIR LINE SKY L+375 04.7500 10/20/2027 | 0.31% |
SOTERA HEALTH TL L+450 05.5000 12/13/2026 | 0.30% |
MOTORCITY TLB L+375 04.2500 10/29/2025 | 0.30% |
PRETIUM PKG HLDG INC L+400 04.2140 10/29/2027 | 0.30% |
MATCH TLB L+175 03.4050 02/13/2027 | 0.30% |
MEREDITH TLB L+250 02.6478 01/31/2025 | 0.30% |
POMEGRANATE MERGER S P/P 144A 09.7500 05/01/2023 | 0.29% |
SS&C TECH TLB5 L+175 03.3953 04/16/2025 | 0.29% |
TALLGRASS NRG PRTNR P/P 144A 04.7500 10/01/2023 | 0.29% |
LEVEL 3 TLB L+175 03.5125 03/01/2027 | 0.29% |
TENET HEALTHCARE 04.6250 07/15/2024 | 0.28% |
SS&C TECH TLB4 L+175 03.4119 04/16/2025 | 0.28% |
APERGY TLB L+250 02.6875 05/09/2025 | 0.27% |
EPICOR SOFTWARE 2NDL L+775 08.7500 07/30/2028 | 0.27% |
CHS/COMMUNITY HEALTH SYS 06.2500 03/31/2023 | 0.26% |
ROBERTSHAW US HOLDING L+350 04.5000 02/28/2025 | 0.25% |
MGM RESORTS INTL 06.0000 03/15/2023 | 0.25% |
FORD MOTOR CREDIT CO LLC 05.5840 03/18/2024 | 0.24% |
REYNOLDS GROUP TL L+300 04.4628 02/05/2023 | 0.24% |
THE GAP INC. P/P 144A 08.3750 05/15/2023 | 0.24% |
BAUSCH HLTH COS INC P/P 144A 07.0000 03/15/2024 | 0.23% |
CHAMPIONX HLDG INC TLB L+500 06.0000 06/03/2027 | 0.23% |
STAPLES INC P/P 144A 07.5000 04/15/2026 | 0.22% |
MEREDITH TLB L+425 05.2500 01/31/2025 | 0.21% |
LIONS GATE CAP HOLD P/P 144A 06.3750 02/01/2024 | 0.20% |
MEREDITH CORP P/P 144A 06.5000 07/01/2025 | 0.19% |
CARNIVAL CORP P/P 144A 11.5000 04/01/2023 | 0.16% |
VIDEOTRON LTD USD 05.0000 07/15/2022 | 0.16% |
SOLERA LLC / SOLERA P/P 144A 10.5000 03/01/2024 | 0.16% |
CARNIVAL CORP TLB L+823 08.0071 06/30/2025 | 0.15% |
ASPLUNDH TLB L+250 02.6634 09/04/2027 | 0.15% |
LADDER CAP FIN LLLP P/P 144A 05.2500 03/15/2022 | 0.15% |
TERRIER MEDIA TLB L+425 04.4345 12/17/2026 | 0.15% |
WASTEQUIP TLB L+350 03/20/2025 | 0.15% |
SOLENIS 2NDL L+850 10.8314 06/26/2026 | 0.13% |
FORD MOTOR CREDIT CO LLC 01.2958 08/03/2022 | 0.11% |
ULTIMATE SOFTWARE 2L L+675 07.5000 05/03/2027 | 0.08% |
GOLDEN NUGGET INC TL L+1225 12.4858 10/04/2023 | 0.07% |
CALIFORNIA RESOURCES CORP SEDOL BMBK002 | 0.05% |
CLEAR CHANNEL OUTDOOR HOLDIN SEDOL BJHVCH9 | 0.05% |
TXU TCEH RIGHTS | 0.04% |
ROYAL CARIBBEAN P/P 144A 09.1250 06/15/2023 | 0.04% |
CHC GRP LLC P/P CV 00.0000 10/01/2021 | 0.02% |
TRIBUNE CLASS 1C LITIGAT | 0.02% |
CHC GROUP LLC P/P SEDOL BYXD3K4 | 0.00% |
CAESARS RESORT TL L+275 02.8966 12/22/2024 | 1.09% |
---|---|
SCIENTIFIC GAMES TLB5 L+275 03.4712 08/14/2024 | 1.08% |
CSC HOLDINGS TLB L+225 02.4024 07/17/2025 | 1.07% |
POWER SOLUTIONS TLB L+350 05.7344 04/30/2026 | 0.98% |
ZAYO GROUP HLDG INC L+300 04.6678 03/09/2027 | 0.94% |
UNIVISION TLB L+375 04.7500 03/24/2026 | 0.91% |
QUIKRETE TLB L+250 04.1594 02/01/2027 | 0.90% |
DELL INTL TLB L+200 04.0500 09/19/2025 | 0.89% |
ORTHO-CLINICAL TLB L+325 03.4056 06/30/2025 | 0.88% |
BWAY CORP TLB L+325 03.5229 04/03/2024 | 0.88% |
HUB INTL TLB L+300 03.2635 04/25/2025 | 0.88% |
PLY GEM TLB L+375 03.9011 04/12/2025 | 0.87% |
ROCKET SOFTWARE TLB L+425 06.7452 11/20/2025 | 0.87% |
ALLIANT HOLD TLB L+275 02.8966 05/10/2025 | 0.85% |
YUM BRANDS TLB L+175 01.9000 04/03/2025 | 0.83% |
GRAY TV TLC L+250 02.6490 11/02/2025 | 0.83% |
PLANTRONICS TLB L+250 02.6563 07/02/2025 | 0.82% |
VERTIV TLB L+300 04.6550 03/02/2027 | 0.81% |
THYELE TL B 1L USD L+425 04.4283 06/30/2027 | 0.81% |
BMC TLB L+425 04.3966 10/02/2025 | 0.80% |
BEACON ROOFING TLB L+225 02.3966 01/02/2025 | 0.79% |
USI INC TLB L+300 03.2204 05/16/2024 | 0.79% |
FOREST CITY TLB L+350 03.6466 12/07/2025 | 0.78% |
NEXSTAR BROAD TLB L+275 04.8070 09/19/2026 | 0.78% |
NAVISTAR INTL TLB L+350 03.6600 11/06/2024 | 0.77% |
TAMKO BUILDING TLB L+325 05.5640 05/31/2026 | 0.77% |
TEMPO ACQUISITION TLB L+325 03.7500 10/01/2026 | 0.76% |
WERNER TLB L+400 05.0000 07/24/2024 | 0.76% |
GLOBAL MEDICAL RESPONS L+475 05.5000 10/05/2025 | 0.76% |
PRIME SECURITY L+325 04.2500 09/23/2026 | 0.75% |
AIR METHODS TLB L+350 04.5000 04/21/2024 | 0.74% |
SFR GROUP SA TLB L+275 02.8966 07/31/2025 | 0.74% |
CLUBCORP TLB L+275 02.9704 09/18/2024 | 0.74% |
DUN & BRADSTREET TLB L+400 07.2411 02/08/2026 | 0.74% |
BAUSCH HEALTH TLB L+300 05.4809 06/01/2025 | 0.73% |
VIRGIN MEDIA TL L+250 02.6524 01/04/2028 | 0.73% |
GRIFOLS TLB L+200 03.7996 11/15/2027 | 0.72% |
BASS PRO TLB L+500 05.7500 09/25/2024 | 0.72% |
ALTRA INDUSTIAL TLB L+200 02.1466 10/01/2025 | 0.72% |
FILTRATION GROUP TLB L+300 03.1466 03/29/2025 | 0.72% |
WEIGHT WATCHERS TLB L+475 05.5000 11/29/2024 | 0.72% |
BY CROWN PARENT LLC L+300 04.0000 01/30/2026 | 0.71% |
TRIDENT TPI HLDG INC L+300 04.0000 10/05/2024 | 0.70% |
BJ'S WHOLESALE TLB L+200 02.1511 02/03/2024 | 0.70% |
SOLERA TLB L+275 02.9380 03/03/2023 | 0.69% |
ATOTECH TLB1 L+300 04.0000 01/31/2024 | 0.69% |
STAPLES TL L+500 05.2510 04/12/2026 | 0.69% |
DIAMOND SPORTS TLB L+325 03.4000 08/24/2026 | 0.69% |
GFL ENVIRONMENTAL TLB L+300 04.0000 05/31/2025 | 0.68% |
BRAND ENERGY TL L+425 05.2500 06/21/2024 | 0.67% |
HUSKY TLB L+300 03.3614 03/28/2025 | 0.65% |
MESSER INDUST TLB L+250 02.7204 03/01/2026 | 0.64% |
TERRIER MEDIA TLB L+425 05.9898 12/17/2026 | 0.64% |
CHARTER COMM TLB2 L+175 03.6391 02/01/2027 | 0.63% |
ENVISION HEALTHCARE TL L+375 03.8966 10/10/2025 | 0.63% |
NEWELL BRANDS INC. 04.3500 04/01/2023 | 0.63% |
PPD TL L+250 03.5000 08/18/2022 | 0.62% |
CREDIT SUISSE NEW YORK 02.8000 04/08/2022 | 0.62% |
CLEAR CHANNEL TLB L+350 05.5435 08/21/2026 | 0.62% |
ARBY'S TLB L+275 04.4095 02/05/2025 | 0.62% |
AKZONOBEL TLB L+300 03.1511 10/01/2025 | 0.62% |
CHARTER COMM OPT LLC/CAP 01.9010 02/01/2024 | 0.62% |
GOLDEN NUGGET TL L+250 04.0811 10/04/2023 | 0.61% |
INTELSAT JACKSON TLB4 L+550 08.7500 01/02/2024 | 0.60% |
DIVERSEY TL L+500 06.0000 09/06/2024 | 0.60% |
REFINITIV TLB L+325 03.3966 10/01/2025 | 0.60% |
RACKSPACE HOSTING INC L+300 04.0000 11/03/2023 | 0.60% |
CERIDIAN TLB L+250 02.6039 04/30/2025 | 0.59% |
ULTIMATE SOFTWARE TL L+375 03.8966 05/03/2026 | 0.59% |
GENESEE & WYOMING TL L+200 03.7743 11/05/2026 | 0.59% |
SOLENIS 1STL L+400 04.2559 06/26/2025 | 0.59% |
BANIJAY GROUP TLB L+375 05.4044 03/04/2025 | 0.59% |
BUCKEYE PARTNERS TLB L+275 04.9443 11/01/2026 | 0.59% |
ELANCO ANIMAL HLTH TLB L+175 03.4044 02/04/2027 | 0.58% |
BLACKSTONE CQP TLB L+350 05.8866 06/20/2024 | 0.58% |
PQ CORP TLB L+225 03.6268 02/07/2027 | 0.58% |
SINCLAIR TV TLB2B L+250 02.6466 07/18/2026 | 0.58% |
THE ADVISOR GROUP TL L+500 07.1444 08/01/2026 | 0.58% |
BERRY PLASTICS TLY L+200 03.8985 07/01/2026 | 0.57% |
FRONTIER COMMUNICAT L+275 06.0000 06/15/2024 | 0.57% |
REYNOLDS TL 341 03.4095 02/04/2027 | 0.56% |
ASCEND LEARNING TLB L+300 04.0000 07/12/2024 | 0.55% |
VICI PROPERTIES TL L+175 01.9058 12/22/2024 | 0.55% |
TALLGRASS ENERGY TL L+475 04.8966 03/11/2026 | 0.54% |
BOYD GAMING TLB L+225 02.3560 09/15/2023 | 0.53% |
LIONS GATE TLB L+225 02.3966 03/24/2025 | 0.52% |
CPG INTL TL L+375 04.7500 05/05/2024 | 0.52% |
THERMON TLB L+375 04.7500 10/30/2024 | 0.52% |
IRON MOUNTAIN TLB L+175 01.8966 01/02/2026 | 0.52% |
PACIFIC GAS & ELECTRIC 01.7173 06/16/2022 | 0.51% |
T-MOBILE USA INC TLB L+300 04/01/2027 | 0.51% |
EPICOR SOFTWARE TLB L+425 05.2500 07/30/2027 | 0.51% |
GRAHAM PACKAGING TL L+375 04.0183 07/28/2027 | 0.51% |
HCA INC 05.8750 05/01/2023 | 0.51% |
LPL HOLDINGS TL L+175 03.6405 11/12/2026 | 0.51% |
SURGERY CENTER HOLDING L+349 04.5739 09/02/2024 | 0.50% |
REYNOLDS GROUP TL L+300 04.4628 02/05/2023 | 0.49% |
VISTRA ENERGY TLB3 L+175 01.8974 12/01/2025 | 0.49% |
ASURION TLB6 L+300 03.1466 11/03/2023 | 0.49% |
SFR GROUP TLB12 L+369 03.8399 01/31/2026 | 0.48% |
GARDA WORLD TLB L+475 06.6903 10/30/2026 | 0.48% |
TOWNSQUARE TLB L+300 04.0000 04/01/2022 | 0.48% |
STARS GROUP TLB L+350 03.7204 07/10/2025 | 0.48% |
AIR MEDICAL TLB L+325 04.2500 04/28/2022 | 0.47% |
REYNOLDS GROUP TL L+325 03.4011 02/16/2026 | 0.47% |
IHEARTMEDIA TLB L+300 04.6595 05/01/2026 | 0.47% |
GATEWAY CASINO TLB L+650 07.5000 03/13/2025 | 0.46% |
CALPINE CONS FIN TL L+200 02.1466 01/15/2025 | 0.46% |
PAREXEL TLB L+275 02.8966 09/27/2024 | 0.45% |
TRANSDIGM INC TLE L+225 05/30/2025 | 0.45% |
COMMSCOPE TLB2 L+325 03.3966 04/04/2026 | 0.45% |
NIELSEN FINANCE LLC L+375 05.0000 06/04/2025 | 0.45% |
WIDEOPENWEST TLB L+325 04.2500 08/19/2023 | 0.45% |
PACIFIC GAS & L+450 05.5000 06/18/2025 | 0.44% |
UNIVAR TLB5 L+200 02.1466 11/22/2026 | 0.44% |
ENTERCOM TLB1 L+250 04.2101 11/17/2024 | 0.43% |
TRANSDIGM INC TLF L+225 03.9094 12/09/2025 | 0.42% |
CIT GROUP INC 05.0000 08/01/2023 | 0.40% |
RESTAURANT BRANDS TLB L+175 03.5080 11/19/2026 | 0.39% |
TRANSDIGM INC. P/P 144A 06.2500 03/15/2026 | 0.39% |
DIAMOND 1 FIN/DIAMON P/P 144A 07.1250 06/15/2024 | 0.39% |
TTM TECH INC TL L+250 02.6490 09/28/2024 | 0.38% |
SS&C TECH TLB3 L+175 03.4119 04/16/2025 | 0.38% |
WESTERN DIGITAL TLB L+175 01.8983 04/29/2023 | 0.38% |
PETSMART INC TLB L+400 04.5000 03/11/2022 | 0.38% |
GATES GLOBAL TLB L+275 03.7500 03/31/2024 | 0.37% |
GARDNER DENVER TLB L+175 03.4109 02/28/2027 | 0.37% |
PACIFIC GAS & ELECTRIC 01.7500 06/16/2022 | 0.37% |
ACADEMY SPORTS TLB L+400 05.0000 07/02/2022 | 0.36% |
ZOETIS INC 00.6930 08/20/2021 | 0.36% |
DIVERSEY TL L+300 03.2606 09/06/2024 | 0.36% |
EXTENDED STAY TLB L+200 02.1564 09/18/2026 | 0.36% |
GLP CAPITAL LP / FIN II 05.3750 11/01/2023 | 0.35% |
ROBERTSHAW TL 2L L+800 09.0000 02/28/2026 | 0.35% |
GREAT LAKES D&D 08.0000 05/15/2022 | 0.33% |
TALBOTS TLB L+700 07.2204 11/28/2022 | 0.33% |
NETFLIX INC 05.7500 03/01/2024 | 0.33% |
LENNAR CORP 04.7500 11/15/2022 | 0.32% |
BOEING CO 04.5080 05/01/2023 | 0.32% |
IHEARTCOMMUNICATI L+400 04.7500 05/01/2026 | 0.32% |
SPRINT CORP 07.2500 09/15/2021 | 0.31% |
COMMSCOPE INC P/P 144A 05.5000 03/01/2024 | 0.31% |
TEVA PHARMACEUTICALS NE USD 02.2000 07/21/2021 | 0.31% |
1011778 BC / NEW RED P/P 144A 04.2500 05/15/2024 | 0.31% |
MARRIOTT INTERNATIONAL 03.1250 02/15/2023 | 0.31% |
ALBERTSONS COS P/P 144A 03.5000 02/15/2023 | 0.30% |
THE ADT SECURITY CORPORATION 03.5000 07/15/2022 | 0.30% |
ICAHN ENTERPRISES/FI 06.2500 02/01/2022 | 0.30% |
DELTA AIR LINE SKY L+375 04.7500 09/16/2027 | 0.30% |
T-MOBILE USA INC 06.0000 03/01/2023 | 0.30% |
SOTERA HEALTH TL L+450 05.5000 12/13/2026 | 0.30% |
MATCH TLB L+175 03.4050 02/13/2027 | 0.29% |
MEREDITH TLB L+250 02.6466 01/31/2025 | 0.29% |
SS&C TECH TLB5 L+175 03.3953 04/16/2025 | 0.29% |
TALLGRASS NRG PRTNR P/P 144A 04.7500 10/01/2023 | 0.28% |
LEVEL 3 TLB L+175 03.5125 03/01/2027 | 0.28% |
TENET HEALTHCARE 04.6250 07/15/2024 | 0.27% |
POMEGRANATE MERGER S P/P 144A 09.7500 05/01/2023 | 0.27% |
SS&C TECH TLB4 L+175 03.4119 04/16/2025 | 0.27% |
APERGY TLB L+250 02.6875 05/09/2025 | 0.27% |
EPICOR SOFTWARE 2NDL L+775 08.7500 07/30/2028 | 0.26% |
CHS/COMMUNITY HEALTH SYS 06.2500 03/31/2023 | 0.25% |
MGM RESORTS INTL 06.0000 03/15/2023 | 0.24% |
FORD MOTOR CREDIT CO LLC 05.5840 03/18/2024 | 0.23% |
ROBERTSHAW US HOLDING L+325 04.2478 02/28/2025 | 0.23% |
THE GAP INC. P/P 144A 08.3750 05/15/2023 | 0.23% |
BAUSCH HLTH COS INC P/P 144A 07.0000 03/15/2024 | 0.22% |
CHAMPIONX HLDG INC TLB L+500 06.0000 06/03/2027 | 0.22% |
STAPLES INC P/P 144A 07.5000 04/15/2026 | 0.21% |
MEREDITH TLB L+425 05.2500 01/31/2025 | 0.21% |
LIONS GATE CAP HOLD P/P 144A 06.3750 02/01/2024 | 0.20% |
GRAY TELEVISION INC P/P 144A 05.1250 10/15/2024 | 0.20% |
MEREDITH CORP P/P 144A 06.5000 07/01/2025 | 0.18% |
CARNIVAL CORP P/P 144A 11.5000 04/01/2023 | 0.16% |
ULTIMATE SOFTWARE L+400 04.7500 05/03/2026 | 0.16% |
SOLERA LLC / SOLERA P/P 144A 10.5000 03/01/2024 | 0.16% |
VIDEOTRON LTD USD 05.0000 07/15/2022 | 0.16% |
CARNIVAL CORP TLB L+774 08.0071 06/30/2025 | 0.15% |
ASPLUNDH TLB L+250 02.6634 08/19/2027 | 0.15% |
WASTEQUIP TLB L+350 03/20/2025 | 0.15% |
TERRIER MEDIA TLB L+425 04.4345 12/17/2026 | 0.14% |
CALIFORNIA RESOURC TL L+475 05.7500 12/31/2022 | 0.12% |
SOLENIS 2NDL L+850 10.8314 06/26/2026 | 0.12% |
FORD MOTOR CREDIT CO LLC 01.3310 08/03/2022 | 0.11% |
ULTIMATE SOFTWARE 2L L+675 07.5000 05/03/2027 | 0.08% |
GOLDEN NUGGET INC TL L+1225 12.4858 10/04/2023 | 0.06% |
CLEAR CHANNEL OUTDOOR HOLDIN SEDOL BJHVCH9 | 0.05% |
ROYAL CARIBBEAN P/P 144A 09.1250 06/15/2023 | 0.04% |
TXU TCEH RIGHTS | 0.04% |
CHC GRP LLC P/P CV 00.0000 10/01/2021 | 0.02% |
TRIBUNE CLASS 1C LITIGAT | 0.02% |
CHC GROUP LLC P/P SEDOL BYXD3K4 | 0.00% |
Fixed income statistics as of 12/31/20
Average effective maturity | 4.28 yrs. |
---|---|
Average effective duration | 0.14 yrs. |
Average yield to maturity | 3.74% |
Average coupon | 3.71% |
Maturity detail as of 12/31/20
0 - 1 yr. | 6.56% |
---|---|
1 - 5 yrs. | 57.71% |
5 - 10 yrs. | 35.73% |
Quality rating as of 12/31/20
AA | 0.61% |
---|---|
BBB | 11.29% |
BB | 36.95% |
B | 45.27% |
CCC and Below | 2.36% |
Not Rated | 0.74% |
Net cash | 2.78% |
Fund characteristics will vary over time.
Due to rounding, percentages may not equal 100%.
Consider these risks before investing: The value of investments in the fund's portfolio may fall or fail to rise over extended periods of time for a variety of reasons, including general economic, political or financial market conditions, investor sentiment and market perceptions, government actions, geopolitical events or changes, and factors related to a specific issuer, geography, industry or sector. These and other factors may lead to increased volatility and reduced liquidity in the fund's portfolio holdings. Lower-rated bonds may offer higher yields in return for more risk. Bond investments are subject to interest-rate risk (the risk of bond prices falling if interest rates rise) and credit risk (the risk of an issuer defaulting on interest or principal payments). Interest-rate risk is generally greater for longer-term bonds, and credit risk is generally greater for below-investment-grade bonds. Unlike bonds, funds that invest in bonds have fees and expenses. Risks associated with derivatives include increased investment exposure (which may be considered leverage) and, in the case of over-the-counter instruments, the potential inability to terminate or sell derivatives positions and the potential failure of the other party to the instrument to meet its obligations. Floating-rate loans may reduce, but not eliminate, interest-rate risk. These loans are typically secured by specific collateral or assets of the issuer (so that holders of the loan, such as the fund, have a priority claim on those assets in the event of the issuer's default or bankruptcy). The value of collateral may be insufficient to meet the issuer's obligations, and the fund's access to collateral may be limited by bankruptcy or other insolvency laws. Our investment techniques, analyses, and judgments may not produce the outcome we intend. The investments we select for the fund may not perform as well as other securities that we do not select for the fund. We, or the fund’s other service providers, may experience disruptions or operating errors that could have a negative effect on the fund. You can lose money by investing in the fund.
Credit qualities are shown as a percentage of the fund's net assets. A bond rated BBB or higher (A-3 or higher, for short-term debt) is considered investment grade. This chart reflects the highest security rating provided by one or more of Standard & Poor’s, Moody’s, and Fitch. Ratings and portfolio credit quality will vary over time. Net cash, if any, represent the market value weights of cash, derivatives, and short-term securities in the portfolio. The fund itself has not been rated by an independent rating agency.
Top industry sectors as of 12/31/20
Consumer cyclicals | 25.60% |
---|---|
Capital goods | 12.67% |
Technology | 12.30% |
Basic materials | 9.85% |
Health care | 8.77% |
Communication services | 8.30% |
Financials | 7.98% |
Consumer staples | 6.40% |
Net Cash | 2.78% |
Other | 5.35% |
0
Allocations may not total 100% of net assets because the table includes the notional value of certain derivatives (the economic value for purposes of calculating periodic payment obligations), in addition to the market value of securities.
Sectors will vary over time.
Country allocation as of 12/31/20
United States | 98.94% |
---|---|
Canada | 0.75% |
Israel | 0.31% |
0
Expenses
Expense ratio |
Class A | Class B | Class C | Class R | Class R6 | Class Y |
---|---|---|---|---|---|---|
Total expense ratio | 1.03% | 1.23% | 1.78% | 1.28% | 0.70% | 0.78% |
What you pay | 1.03% | 1.23% | 1.78% | 1.28% | 0.70% | 0.78% |
Sales charge
Breakpoint | Class A | Class B | Class C | Class R | Class R6 | Class Y |
---|---|---|---|---|---|---|
$0-$49,999 | 2.25% / 2.00% | 0.00% / 1.00% | 0.00% / 1.00% | -- | -- | -- |
$50,000-$99,999 | 2.25% / 2.00% | 0.00% / 1.00% | 0.00% / 1.00% | -- | -- | -- |
$100,000-$249,999 | 1.75% / 1.50% | -- | 0.00% / 1.00% | -- | -- | -- |
$250,000-$499,999 | 1.25% / 1.00% | -- | 0.00% / 1.00% | -- | -- | -- |
$500,000-$999,999 | 0.00% / 1.00% | -- | -- | -- | -- | -- |
$1M-$4M | 0.00% / 1.00% | -- | -- | -- | -- | -- |
$4M-$50M | 0.00% / 0.50% | -- | -- | -- | -- | -- |
$50M+ | 0.00% / 0.25% | -- | -- | -- | -- | -- |
CDSC
Class A (sales for $500,000+) | Class B | Class C | Class R | Class R6 | Class Y | |
---|---|---|---|---|---|---|
0 to 9 mts. | 1.00% | 1.00% | 1.00% | -- | -- | -- |
9 to 12 mts. | 1.00% | 1.00% | 1.00% | -- | -- | -- |
2 yrs. | 0.00% | 0.50% | 0.00% | -- | -- | -- |
3 yrs. | 0.00% | -- | 0.00% | -- | -- | -- |
4 yrs. | 0.00% | -- | 0.00% | -- | -- | -- |
5 yrs. | 0.00% | -- | 0.00% | -- | -- | -- |
6 yrs. | 0.00% | -- | 0.00% | -- | -- | -- |
7+ yrs. | 0.00% | -- | 0.00% | -- | -- | -- |
Trail commissions
Class A | Class B | Class C | Class R | Class R6 | Class Y | |
---|---|---|---|---|---|---|
0.25% | 0.25% | 1.00% | 0.50% | 0.00% | 0.00% | |
NA | NA | NA | NA | NA | NA | |
NA | NA | NA | NA | NA | NA |
For sales and trail commission information on purchases over $500,000 and participant-directed qualified retirement plans, see a Putnam fund prospectus and the statement of additional information.
The S&P/LSTA Leveraged Loan Index is an unmanaged index of U.S. leveraged loans. You cannot invest directly in an index.
Consider these risks before investing: The value of investments in the fund's portfolio may fall or fail to rise over extended periods of time for a variety of reasons, including general economic, political or financial market conditions, investor sentiment and market perceptions, government actions, geopolitical events or changes, and factors related to a specific issuer, geography, industry or sector. These and other factors may lead to increased volatility and reduced liquidity in the fund's portfolio holdings. Lower-rated bonds may offer higher yields in return for more risk. Bond investments are subject to interest-rate risk (the risk of bond prices falling if interest rates rise) and credit risk (the risk of an issuer defaulting on interest or principal payments). Interest-rate risk is generally greater for longer-term bonds, and credit risk is generally greater for below-investment-grade bonds. Unlike bonds, funds that invest in bonds have fees and expenses. Risks associated with derivatives include increased investment exposure (which may be considered leverage) and, in the case of over-the-counter instruments, the potential inability to terminate or sell derivatives positions and the potential failure of the other party to the instrument to meet its obligations. Floating-rate loans may reduce, but not eliminate, interest-rate risk. These loans are typically secured by specific collateral or assets of the issuer (so that holders of the loan, such as the fund, have a priority claim on those assets in the event of the issuer's default or bankruptcy). The value of collateral may be insufficient to meet the issuer's obligations, and the fund's access to collateral may be limited by bankruptcy or other insolvency laws. Our investment techniques, analyses, and judgments may not produce the outcome we intend. The investments we select for the fund may not perform as well as other securities that we do not select for the fund. We, or the fund’s other service providers, may experience disruptions or operating errors that could have a negative effect on the fund. You can lose money by investing in the fund.
Credit qualities are shown as a percentage of the fund's net assets. A bond rated BBB or higher (A-3 or higher, for short-term debt) is considered investment grade. This chart reflects the highest security rating provided by one or more of Standard & Poor’s, Moody’s, and Fitch. Ratings and portfolio credit quality will vary over time. Net cash, if any, represent the market value weights of cash, derivatives, and short-term securities in the portfolio. The fund itself has not been rated by an independent rating agency.