- Market volatility in 2018 hit investors accustomed to the calm of 2017
- In fact, 2018 volatility was near the long-term average
- 2019 might feel similar to 2018 as many issues can spark ups and downs
2017 was a year in which nothing bothered markets. These conditions set the stage for an historic low-volatility environment, strong equity returns, and, as a result, strong risk-adjusted returns.
The picture began to change in 2018 when geopolitical risk, monetary policy, trade wars, inflation concerns, and an aging bull market all contributed to the return of normal volatility.
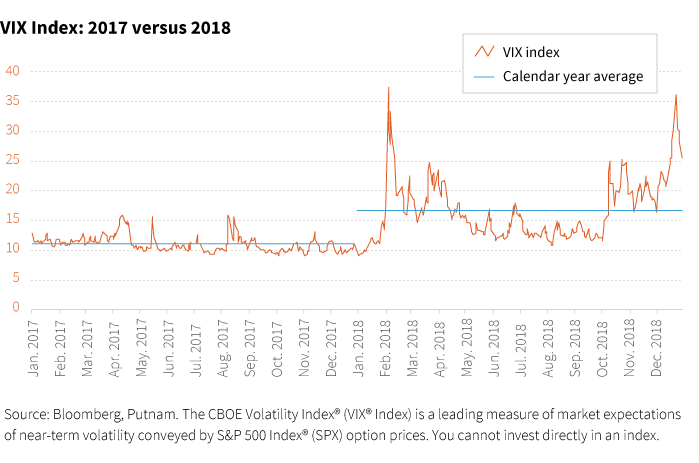
The VIX in perspective: 2017 vs. 2018
- In 2017, the VIX closed under 10 on 52 days
- In 2018, the VIX closed under 10 on 7 days, and all of them were in January
- In 2017, the high close for the VIX was 16.04
- In 2018, the high close was 37.32
- Also in 2018, the VIX had 113 closes higher than the 2017 high
- In 2017, the average VIX close was 11.09
- In 2018, the average VIX close was 16.64
- 2018 had 238 closes above the 2017 average
Investors have been feeling the volatility through the daily performance of the S&P 500.

Daily returns in perspective: 2017 vs. 2018
- 2017 had only 8 daily moves greater than 1% (four were positive and four were negative)
- 2018 had 64 daily moves greater than 1% (32 were positive and 32 were negative)
- 2017 had ZERO daily moves greater than 2%
- 2018 had 20 daily moves greater than 2% (5 were positive and 15 were negative)
These comparisons suggest 2018 was a volatile year. The reality is that 2018 was much more a reversion toward the mean — the average volatility levels seen over longer periods. Since 1990, the VIX average close is 19.26 and the median close is 17.39. In comparison, the 2018 average close of 16.64 is still below the long-term average. Since 1990, the S&P 500 has averaged 63 daily moves of 1% per calendar year, which is in line with the 64 that investors experienced in 2018.
2019 could look like 2018
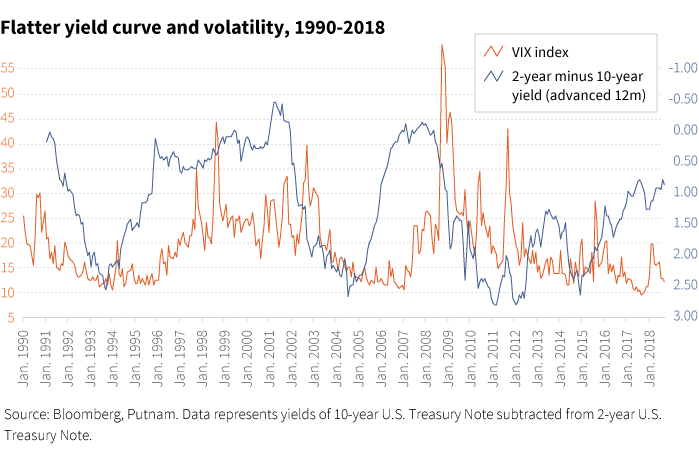
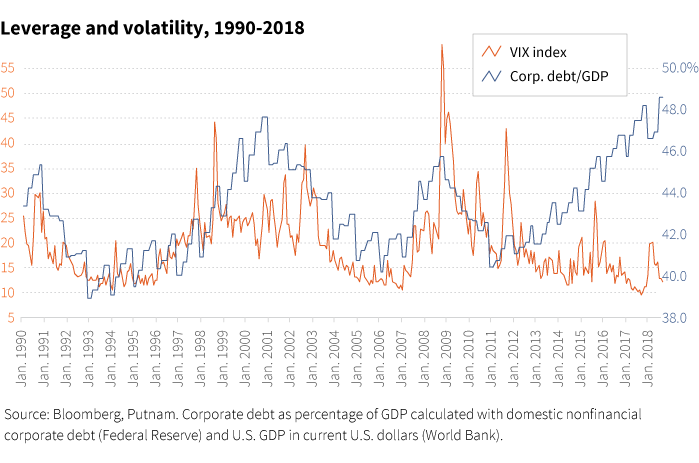
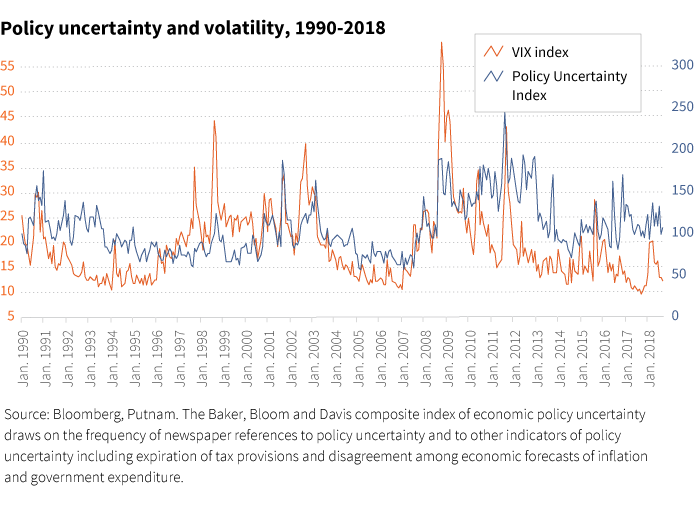
Moving forward into 2019, market volatility will likely persist at current levels, and may even be poised to increase. Three indicators signal this trend.
Historically, volatility tends to trend higher when the yield curve is flatter, and it is nearly flat today:

Volatility also tends to increase when the corporate debt-to-GDP ratio becomes extended:

Last, volatility also often rises when there is more policy uncertainty:

Also, the current environment has a number of issues that can trigger market volatility: jittery investors, the near-decade length of the bull run, trade wars and trade-war rhetoric, a steep drop in the price of oil, and recession fears, to name a few.
315546
For informational purposes only. Not an investment recommendation.
This material is provided for limited purposes. It is not intended as an offer or solicitation for the purchase or sale of any financial instrument, or any Putnam product or strategy. References to specific asset classes and financial markets are for illustrative purposes only and are not intended to be, and should not be interpreted as, recommendations or investment advice. The opinions expressed in this article represent the current, good-faith views of the author(s) at the time of publication. The views are provided for informational purposes only and are subject to change. This material does not take into account any investor’s particular investment objectives, strategies, tax status, or investment horizon. Investors should consult a financial advisor for advice suited to their individual financial needs. Putnam Investments cannot guarantee the accuracy or completeness of any statements or data contained in the article. Predictions, opinions, and other information contained in this article are subject to change. Any forward-looking statements speak only as of the date they are made, and Putnam assumes no duty to update them. Forward-looking statements are subject to numerous assumptions, risks, and uncertainties. Actual results could differ materially from those anticipated. Past performance is not a guarantee of future results. As with any investment, there is a potential for profit as well as the possibility of loss.
Diversification does not guarantee a profit or ensure against loss. It is possible to lose money in a diversified portfolio.
Consider these risks before investing: International investing involves certain risks, such as currency fluctuations, economic instability, and political developments. Investments in small and/or midsize companies increase the risk of greater price fluctuations. Bond investments are subject to interest-rate risk, which means the prices of the fund’s bond investments are likely to fall if interest rates rise. Bond investments also are subject to credit risk, which is the risk that the issuer of the bond may default on payment of interest or principal. Interest-rate risk is generally greater for longer-term bonds, and credit risk is generally greater for below-investment-grade bonds, which may be considered speculative. Unlike bonds, funds that invest in bonds have ongoing fees and expenses. Lower-rated bonds may offer higher yields in return for more risk. Funds that invest in government securities are not guaranteed. Mortgage-backed securities are subject to prepayment risk. Commodities involve the risks of changes in market, political, regulatory, and natural conditions. You can lose money by investing in a mutual fund.
Putnam Retail Management.


