


With recession rumblings in the air, some investors are reconsidering their value and growth stock allocations in defined contribution plans. Although conventional wisdom states value stocks outperform growth stocks during recessions, some evidence suggests otherwise. A look at historical data suggests growth investing may still makes sense, particularly when considering funds focused on durable growth.
Key takeaways:
- Historical data on the Russell 1000 Growth and Russell 1000 Value indexes suggests that growth stocks have generally outperformed value stocks during economic slowdowns.
- The Fama-French Model suggests companies with higher quality and profitability factors can demonstrate durable growth during periods of economic stress.
- Proper diversification between value and growth is still critical, particularly as the economy exits a recession.
Growth vs. value: Historical performance during recessions
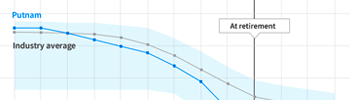
Food for thought: In periods of slowing economic activity, the Russell 1000 Growth Index has historically outperformed the Russell 1000 Value Index. One explanation for this is when the economy slows, fewer companies can grow earnings than in periods of economic expansion. Another reason may be that disruptive and innovative companies produce products or services that are not sensitive to changes in GDP. These companies may not rely on the tailwinds of a strong economy to grow their businesses.1
Figure 1: Russell 1000 Growth Index versus Russell 1000 Value Index

Source: Putnam, using data from NBER and Frank Russell Company.
Does this mean value allocations should be abandoned? No. Prudent allocation decisions are important at all times, through all cycles. As the table shows, the Russell 1000 Value Index generated a median 4.15% return in economic slowdowns, while the Russell 1000 Growth median return was 9.39%. While noting that past performance does not predict the future, reviewing economic history may be comforting to plan participants.
Not all growth is created equal
The Fama and French factor model is an asset pricing model initially developed in 1992 by Nobel Laureate Eugene Fama and Professor Kenneth French. In 2014, Fama and French adapted their original three-factor model to include two additional factors. One of these factors focused on profitability. The profitability factor suggests that companies that report more robust earnings have generated higher returns.2
The Fama and French model calculates profitability by taking a company's earnings before tax divided by shareholder equity — essentially a pretax return on equity calculation. The higher the return on equity, the better, as it measures a company's capital efficiency. We calculated cumulative returns in the large-cap cohort on an equal-weighted basis, with terciles of profitability as a measure of quality in the large-cap space.
Figure 2: Quality factor performance amid slowing growth

Source: http://mba.tuck.dartmouth.edu/pages/faculty/ken.french/index.html.
Measured by quality, the top one third of companies generated higher cumulative returns relative to the companies in the third tercile in five of the six periods of economic slowdown. This data may suggest investors can benefit by focusing on companies generating robust returns on equity during periods of economic challenge. Investors may want to focus their growth allocation on companies with high quality and durable growth during periods of economic stress.
Conclusion
Remaining diversified between growth and value makes sense especially during times of economic uncertainty. Rather than stopping or slowing allocations to growth, retirement investors may be well served by evaluating the durability and quality of the growth companies they are investing in.
Looking back at the recessions of 1980, 1982, 1991, 2001, and 2009, we find growth tends to outperform value in the 12 months prior to a recession through to the trough of the recession. As the economy exits a recession, value tends to outperform growth.
Past performance is not a guarantee of future results.
The Russell 1000® Growth Index is an unmanaged index of those companies in the large-cap Russell 1000 Index chosen for their growth orientation. The Russell 1000® Value Index is an unmanaged index of those companies in the large-cap Russell 1000 Index chosen for their value orientation.
Frank Russell Company is the source and owner of the trademarks, service marks, and copyrights related to the Russell Indexes. Russell® is a trademark of Frank Russell Company.
For informational purposes only. Not an investment recommendation.
You cannot directly invest in an index.
2 https://papers.ssrn.com/sol3/papers.cfm?abstract_id=2287202

333994
For informational purposes only. Not an investment recommendation.
This material is provided for limited purposes. It is not intended as an offer or solicitation for the purchase or sale of any financial instrument, or any Putnam product or strategy. References to specific asset classes and financial markets are for illustrative purposes only and are not intended to be, and should not be interpreted as, recommendations or investment advice. The opinions expressed in this article represent the current, good-faith views of the author(s) at the time of publication. The views are provided for informational purposes only and are subject to change. This material does not take into account any investor’s particular investment objectives, strategies, tax status, or investment horizon. Investors should consult a financial advisor for advice suited to their individual financial needs. Putnam Investments cannot guarantee the accuracy or completeness of any statements or data contained in the article. Predictions, opinions, and other information contained in this article are subject to change. Any forward-looking statements speak only as of the date they are made, and Putnam assumes no duty to update them. Forward-looking statements are subject to numerous assumptions, risks, and uncertainties. Actual results could differ materially from those anticipated. Past performance is not a guarantee of future results. As with any investment, there is a potential for profit as well as the possibility of loss.
Diversification does not guarantee a profit or ensure against loss. It is possible to lose money in a diversified portfolio.
Consider these risks before investing: International investing involves certain risks, such as currency fluctuations, economic instability, and political developments. Investments in small and/or midsize companies increase the risk of greater price fluctuations. Bond investments are subject to interest-rate risk, which means the prices of the fund’s bond investments are likely to fall if interest rates rise. Bond investments also are subject to credit risk, which is the risk that the issuer of the bond may default on payment of interest or principal. Interest-rate risk is generally greater for longer-term bonds, and credit risk is generally greater for below-investment-grade bonds, which may be considered speculative. Unlike bonds, funds that invest in bonds have ongoing fees and expenses. Lower-rated bonds may offer higher yields in return for more risk. Funds that invest in government securities are not guaranteed. Mortgage-backed securities are subject to prepayment risk. Commodities involve the risks of changes in market, political, regulatory, and natural conditions. You can lose money by investing in a mutual fund.
Putnam Retail Management.