


Current performance may be lower or higher than the quoted past performance, which cannot guarantee future results. Share price, principal value, and return will vary, and you may have a gain or loss when you sell your shares. Performance assumes reinvestment of distributions and does not account for taxes. Class A, B, C, and R shares have no initial sales charge. Class B shares reflect the applicable contingent deferred sales charge (CDSC), which is 5% in the first year, declines to 1% in the sixth year, and is eliminated thereafter. Class C shares reflect a 1% CDSC for the first year that is eliminated thereafter. Performance for B, C, and R shares before their inception is derived from the historical performance of class A shares, adjusted for the applicable sales charge (or CDSC) and higher operating expenses for such shares. Class A and R shares generally have no CDSC. Please see the fund's prospectus for more details. Yield more closely reflects current performance than total return.
Money Market Fund (Class A) (PDDXX)
Pursuing income while preserving capital with short-term investments since 1976
Highlights
Objective
The fund seeks to provide as high a rate of current income as we believe is consistent with preservation of capital and maintenance of liquidity.
Strategy and process
- Capital preservation The fund invests in highly rated money market instruments to maintain a stable net asset value and protect investors' wealth.
- Attractive income The portfolio managers use credit research to select a diverse portfolio of securities that offer above-average yields.
- Leading research The managers, supported by Putnam's fixed income research division, manage risk by analyzing individual securities and overall market conditions.
Fund price and assets |
Prior close | 52-week high | 52-week low | Net assets and outstanding shares |
|---|---|---|---|---|
| Net asset value |
$1.00
0.00% | $0.00 |
$1.00
04/25/24 |
$1.00
04/25/24 |
Download CSV |
Fund facts as of 03/31/24
$847.10M
--
Monthly
41
September
746923101 / 0008
10/01/76
Fixed Income
PDDXX
Management team


Literature
Fund documents |
| Fact Sheet (A share) (PDF) |
| Prospectuses/SAI |
| Annual Report (PDF) |
| Semiannual Report (PDF) |
| Proxy voting results (Form N-PX) (PDF) |
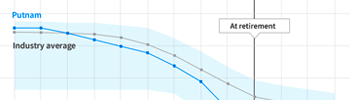
Defining consistent performance in retirement strategies
Discover the essential principles of investing and how they can help you achieve long-term goals. Learn more.Why Gaza war has not yet caused an oil price spike
The calamity of war in Gaza since early October has so far had a more muted impact on oil prices than might have been expected. We analyze the market and share our outlook.Behind the ChatGPT hype: What generative AI means for investors
The use cases for generative AI will be broad, and we expect it to be highly disruptive to many industries while offering compelling opportunities for investors.Performance
Total return (%) as of 03/31/24
Annual performance as of 03/31/24
Annualized Total return (%) as of 03/31/24
| Annualized performance | 1 yr. | 3 yrs. | 5 yrs. | 10 yrs. |
|---|---|---|---|---|
| Before sales charge | 5.12% | 2.53% | 1.86% | 1.21% |
| After sales charge | 5.12% | 2.53% | 1.86% | 1.21% |
Performance snapshot
| Before sales charge | After sales charge | ||
|---|---|---|---|
| 1 mt. as of 03/31/24 | 0.43% | 0.43% | |
| YTD as of 04/25/24 or prior close | 1.64% | 1.64% | |
Yield
| 7-day yield as of 04/25/24 | 5.10% |
|---|---|
| 30-day yield as of 04/25/24 | 5.10% |
Lipper rankings as of 03/31/24
| Time period | Rank/Funds in category | Percentile ranking |
|---|---|---|
| 1 yr. | 41/83 | 49% |
| 3 yrs. | 40/82 | 49% |
| 5 yrs. | 40/80 | 50% |
| 10 yrs. | 25/53 | 47% |
Distributions
| Accrual days | 31 |
|---|---|
| Accrual start date | 03/01/24 |
| Accrual end date | 03/31/24 |
| Payable date | 03/28/24 |
| Income | $0.004331945 |
| Extra taxable income | -- |
| Dividend frequency | Monthly |
Lipper rankings are based on total return without sales charge relative to all share classes of funds with similar objectives as determined by Lipper. Past performance is not indicative of future results.
Morningstar Ratings for the specific share classes only; other classes may have different performance characteristics.
The Morningstar Rating™ for funds, or "star rating", is calculated for managed products (including mutual funds, variable annuity and variable life subaccounts, exchange-traded funds, closed-end funds, and separate accounts) with at least a 3-year history. Exchange-traded funds and open-ended mutual funds are considered a single population for comparative purposes. It is calculated based on a Morningstar Risk-Adjusted Return measure that accounts for variation in a managed product's monthly excess performance, placing more emphasis on downward variations and rewarding consistent performance. The Morningstar Rating does not include any adjustment for sales loads. The top 10% of products in each product category receive 5 stars, the next 22.5% receive 4 stars, the next 35% receive 3 stars, the next 22.5% receive 2 stars, and the bottom 10% receive 1 star. The Overall Morningstar Rating for a managed product is derived from a weighted average of the performance figures associated with its 3-, 5-, and 10-year (if applicable) Morningstar Rating metrics. The weights are: 100% 3-year rating for 36–59 months of total returns, 60% 5-year rating/40% 3-year rating for 60–119 months of total returns, and 50% 10-year rating/30% 5-year rating/20% 3-year rating for 120 or more months of total returns. While the 10-year overall star rating formula seems to give the most weight to the 10-year period, the most recent 3-year period actually has the greatest impact because it is included in all three rating periods.
Some of Morningstar's proprietary calculations, including the Morningstar Rating™, are not customarily calculated based on adjusted historical returns. However, for new share classes/channels, Morningstar may calculate an extended performance Morningstar Rating that is based, in part, on adjusted historical (or "pre-inception") returns for periods prior to the inception of the share class of the fund shown herein ("Report Share Class").
The extended performance is calculated by creating a performance stream consisting of the Report Share Class and older share class(s). Morningstar adjusts the historical total returns of the older share class(es) of a fund to reflect higher expenses in the Report Share Class. Morningstar does not hypothetically adjust returns upwards for lower expenses.
The extended performance Morningstar Risk-Adjusted Return is then calculated for 3-, 5-, and 10-year time periods and used to determine the extended performance Morningstar Rating. The extended performance Morningstar Rating for this fund does not affect the retail fund data published by Morningstar, as the bell curve distribution on which the ratings are based includes only funds with actual returns. The Overall Morningstar Rating for multi-share open-end funds will be either based on actual performance only or extended performance only. Once the share class turns three years old, the Overall Morningstar Rating will be based on actual ratings only. The Overall Morningstar Rating for multi-share variable annuities is based on a weighted average of any ratings that are available.
While the inclusion of pre-inception data, in the form of extended performance, can provide valuable insight into the probable long-term behavior of newer share classes of a fund, investors should be aware that an adjusted historical return can only provide an approximation of that behavior. For example, the fee structures of a retail share class will vary from that of an institutional share class, as retail shares tend to have higher operating expenses and sales charges. These adjusted historical returns are not actual returns. The underlying investments in the share classes used to calculate the pre-performance string will likely vary from the underlying investments held in the fund after inception. Calculation methodologies utilized by Morningstar may differ from those applied by other entities, including the fund itself.
© 2023 Morningstar. All Rights Reserved. The information contained herein: (1) is proprietary to Morningstar and/or its content providers; (2) may not be copied or distributed; and (3) is not warranted to be accurate, complete or timely. Neither Morningstar nor its content providers are responsible for any damages or losses arising from any use of this information. Past performance is no guarantee of future results.
The up-market capture ratio is used to evaluate how well an investment manager performed relative to an index during periods when that index has risen. The ratio is calculated by dividing the manager’s returns by the returns of the index during the up-market, and multiplying that factor by 100. The down-market capture ratio is used to evaluate how well an investment manager performed relative to an index during periods when that index has dropped. The ratio is calculated by dividing the manager’s returns by the returns of the index during the down-market and multiplying that factor by 100.
Compare
See how this fund stacks up against its peers with FundVisualizer®
New to FundVisualizer? Watch tutorials on how to get started.


For more tutorials, please visit fundvisualizer.com
** FundVisualizer comparison based on Putnam fund versus the largest fund in its Morningstar category.
Holdings
| Commonwealth Bank Of Australia | 2.41% |
|---|---|
| Wells Fargo Bank NA | 2.36% |
| Bank of America | 2.24% |
| ABN Amro Funding | 1.99% |
| Credit Agricole Corp&Inv Bank | 1.95% |
| ING US Funding | 1.95% |
| Sumitomo Mitsui Banking Corp | 1.95% |
| Bpce | 1.93% |
| Bank Of Montreal | 1.83% |
| Liberty street funding | 1.46% |
| Top 10 issuers, percent of portfolio | 20.07% |
| Top 10 issuers as of 03/31/24 | |
|---|---|
| Commonwealth Bank Of Australia | |
| Wells Fargo Bank NA | |
| Bank of America | |
| ABN Amro Funding | |
| Credit Agricole Corp&Inv Bank | |
| ING US Funding | |
| Sumitomo Mitsui Banking Corp | |
| Bpce | |
| Bank Of Montreal | |
| Liberty street funding | |
| Issuers represent 20.07% of portfolio | |
| Top 10 issuers as of 02/29/24 | |
|---|---|
| Wells Fargo Bank NA | |
| Citibank | |
| National Australia Bank | |
| Australia & New Zealand Banking Group | |
| CHARIOT FUNDING LLC | |
| ING US Funding | |
| Sumitomo Mitsui Banking Corp | |
| BPCE SA | |
| Royal Bank Of Canada | |
| Bnp Paribas | |
| Issuers represent 20.38% of portfolio | |
| Top 10 issuers as of 01/31/24 | |
|---|---|
| Australia & New Zealand Banking Group | |
| Citibank | |
| Wells Fargo Bank NA | |
| National Australia Bank | |
| Royal Bank Of Canada | |
| Lloyds Bank PLC | |
| BPCE SA | |
| Bnp Paribas | |
| Dnb Bank ASA | |
| Banco Santander | |
| Issuers represent 20.08% of portfolio | |
| Top 10 issuers as of 12/31/23 | |
|---|---|
| National Australia Bank | |
| Australia & New Zealand Banking Group | |
| Royal Bank Of Canada | |
| Mizuho Bank | |
| Sumitomo Mitsui trust bank | |
| Dnb Bank ASA | |
| Banco Santander | |
| Canadian Imperial Bank of Commerce | |
| Toronto-Dominion Bank/The | |
| Citibank | |
| Issuers represent 17.68% of portfolio | |
Full holdings
Portfolio composition as of 03/31/24
| Repurchase agreements | 51.67% |
|---|---|
| Commercial paper | 23.46% |
| Certificates of deposit | 19.37% |
| Asset-backed commercial paper | 4.83% |
| Corporate bonds and notes | 0.89% |
| Cash and net other assets | -0.21% |
Fixed income statistics as of 03/31/24
| Average maturity | 21.04 days |
|---|
Fund characteristics will vary over time.
Due to rounding, percentages may not equal 100%.
Consider these risks before investing: The value of investments in the fund’s portfolio may fall or fail to rise over extended periods of time for a variety of reasons, including general economic, political, or financial market conditions; investor sentiment and market perceptions; government actions; geopolitical events or changes; and factors related to a specific issuer, geography, industry, or sector. These and other factors may lead to increased volatility and reduced liquidity in the fund’s portfolio holdings.
Although the fund seeks to preserve the value of your investment at $1.00 per share, there is no guarantee it will do so. The fund may impose a fee upon the sale of your shares or may temporarily suspend your ability to sell shares if the fund’s liquidity falls below certain required minimums because of market conditions or other factors. An investment in the fund is not insured or guaranteed by the Federal Deposit Insurance Corporation or any other government agency. The fund’s sponsor has no legal obligation to provide financial support to the fund, and you should not expect that the sponsor will provide financial support to the fund at any time.
The values of money market investments usually rise and fall in response to changes in interest rates. Interest-rate risk is generally lowest for investments with short maturities (a significant part of the fund’s investments). To the extent that the fund invests significantly in a particular industry, it runs an increased risk of loss if developments affecting that industry cause the prices of related money market investments to fall. Although the fund only buys high-quality investments, investments backed by a letter of credit have the risk that the provider of the letter of credit will not be able to fulfill its obligations to the issuer. The effects of inflation may erode the value of your investment over time. Foreign investments, including money market instruments of foreign issuers that are denominated in U.S. dollars, involve certain special risks, such as unfavorable political and legal developments, limited financial information, and economic and financial instability.
Our investment techniques, analyses, and judgments may not produce the outcome we intend. The investments we select for the fund may not perform as well as other securities that we do not select for the fund. We, or the fund’s other service providers, may experience disruptions or operating errors that could have a negative effect on the fund. You can lose money by investing in the fund.
Expenses
Expense ratio |
Class A | Class B | Class C | Class R |
|---|---|---|---|---|
| Total expense ratio | 0.47% | 0.47% | 0.47% | 0.47% |
| What you pay | 0.47% | 0.47% | 0.47% | 0.47% |
Sales charge
| Breakpoint | Class A | Class B | Class C | Class R |
|---|---|---|---|---|
| $0-$49,999 | -- | -- | -- | -- |
| $50,000-$99,999 | -- | -- | -- | -- |
| $100,000-$249,999 | -- | -- | -- | -- |
| $250,000-$499,999 | -- | -- | -- | -- |
| $500,000-$999,999 | -- | -- | -- | -- |
| $1M-$4M | -- | -- | -- | -- |
| $4M-$50M | -- | -- | -- | -- |
| $50M+ | -- | -- | -- | -- |
CDSC
| Class A | Class B | Class C | Class R | |
|---|---|---|---|---|
| 0 to 9 mts. | -- | -- | -- | -- |
| 9 to 12 mts. | -- | -- | -- | -- |
| 2 yrs. | -- | -- | -- | -- |
| 3 yrs. | -- | -- | -- | -- |
| 4 yrs. | -- | -- | -- | -- |
| 5 yrs. | -- | -- | -- | -- |
| 6 yrs. | -- | -- | -- | -- |
| 7+ yrs. | -- | -- | -- | -- |
Trail commissions
| Class A | Class B | Class C | Class R | |
|---|---|---|---|---|
| 0.00% | 0.00% | 0.00% | 0.00% | |
| NA | NA | NA | NA | |
| NA | NA | NA | NA |
Asset Liquidity
A multi-faceted view of the portfolio
Below you can find continuously updated views of the portfolio's daily and weekly liquid asset levels, its net asset value (NAV), and asset flows into and out of the portfolio. Together, these graphs provide insights on the portfolio's resilience during periods of heightened risk in the money market, and are the focus of government policies designed to maintain market stability.
Daily and weekly liquid assets as of or prior close
This graph displays the percentage of the fund's total assets invested in daily and weekly liquid assets as of the end of each business day during the preceding six months. The fund is required to invest at least 10% of its total assets in daily liquid assets and at least 30% of its total assets in weekly liquid assets. Daily liquid assets include cash, direct obligations of the U.S. government, securities that will mature or are subject to a demand feature that is exercisable and payable within one business day, and receivables scheduled to be paid within one business day. Weekly liquid assets include daily liquid assets, government agency discount notes with remaining maturities of 60 days or less, securities that will mature or are subject to a demand feature that is exercisable and payable within five business days, and receivables scheduled to be paid within five business days.
Fluctuating net asset value as of or prior close
This graph displays the fund's daily net asset value (NAV) per share during the preceding six months as if it were calculated using the market value of the fund's portfolio as of the end of each business day during that period.
The market-value or "shadow" net asset value per share shown below for a given day may differ from the official NAV used for transactions in fund shares. The official NAV is shown on the "Highlights" tab. The shadow net asset value per share shown below does not reflect the application of the amortized cost method of valuing fund portfolio holdings, which normally allows the fund to maintain an official NAV of $1.00 per share. When a shareholder buys or redeems fund shares, the official NAV would be used as the net asset value per share.
Daily net asset flows as of or prior close
This graph displays the dollar amount of net shareholder inflows or outflows of the fund as of the end of each business day during the preceding six months.
In accordance with recent rule changes by the SEC, Putnam Money Market Fund intends to operate as a "retail money market fund" as defined by Rule 2a-7. As a result, the fund will only be available to natural persons and, effective on or about October 10, 2016, will be subject to liquidity fees and redemption gates under certain circumstances. For more information, see the fund's latest prospectus.
You could lose money by investing in the fund. Although the fund seeks to preserve the value of your investment at $1.00 per share, it cannot guarantee it will do so. The fund may impose a fee upon sale of your shares or may temporarily suspend your ability to sell shares if the fund's liquidity falls below required minimums because of market conditions or other factors. An investment in the fund is not insured or guaranteed by the Federal Deposit Insurance Corporation or any other government agency. The fund's sponsor has no legal obligation to provide financial support to the fund, and you should not expect that the sponsor will provide financial support to the fund at any time.
Yield more closely reflects current performance than total return.
Consider these risks before investing: The value of investments in the fund’s portfolio may fall or fail to rise over extended periods of time for a variety of reasons, including general economic, political, or financial market conditions; investor sentiment and market perceptions; government actions; geopolitical events or changes; and factors related to a specific issuer, geography, industry, or sector. These and other factors may lead to increased volatility and reduced liquidity in the fund’s portfolio holdings.
Although the fund seeks to preserve the value of your investment at $1.00 per share, there is no guarantee it will do so. The fund may impose a fee upon the sale of your shares or may temporarily suspend your ability to sell shares if the fund’s liquidity falls below certain required minimums because of market conditions or other factors. An investment in the fund is not insured or guaranteed by the Federal Deposit Insurance Corporation or any other government agency. The fund’s sponsor has no legal obligation to provide financial support to the fund, and you should not expect that the sponsor will provide financial support to the fund at any time.
The values of money market investments usually rise and fall in response to changes in interest rates. Interest-rate risk is generally lowest for investments with short maturities (a significant part of the fund’s investments). To the extent that the fund invests significantly in a particular industry, it runs an increased risk of loss if developments affecting that industry cause the prices of related money market investments to fall. Although the fund only buys high-quality investments, investments backed by a letter of credit have the risk that the provider of the letter of credit will not be able to fulfill its obligations to the issuer. The effects of inflation may erode the value of your investment over time. Foreign investments, including money market instruments of foreign issuers that are denominated in U.S. dollars, involve certain special risks, such as unfavorable political and legal developments, limited financial information, and economic and financial instability.
Our investment techniques, analyses, and judgments may not produce the outcome we intend. The investments we select for the fund may not perform as well as other securities that we do not select for the fund. We, or the fund’s other service providers, may experience disruptions or operating errors that could have a negative effect on the fund. You can lose money by investing in the fund.