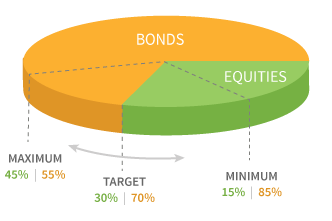
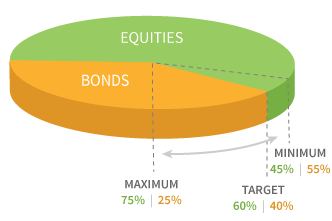
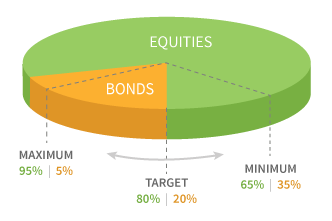
We offer three dynamic portfolios aligned with growth, balanced, or conservative investment goals.
Dynamic Asset Allocation Conservative Fund (PACYX)
A globally diversified fund for preserving wealth
This fund received a Overall Morningstar Rating™ out of 137 funds in the Conservative Allocation category based on total return as of 06/30/24
Dynamic Asset Allocation Balanced Fund (PABYX)
A globally diversified fund pursuing a balance of growth and income
This fund received a Overall Morningstar Rating™ out of 689 funds in the Moderate Allocation category based on total return as of 06/30/24
Dynamic Asset Allocation Growth Fund (PAGYX)
A globally diversified fund pursuing growth
This fund received a Overall Morningstar Rating™ out of 302 funds in the Moderately Aggressive Allocation category based on total return as of 06/30/24
Equity and fixed-income allocations have a flexible range of +/- 15%, allowing the strategies to take advantage of the most attractive opportunities.
Our active managers have experience managing diversified strategies over multiple market cycles
The GAA investment team has worked together for more than a decade and is part of a long-tenured multi-asset group founded by Putnam in 1994.


(pictured left to right):
Robert J. Schoen, Co-Chief Investment Officer, Global Asset Allocation (investing since 1990)
Brett S. Goldstein, CFA, Co-Chief Investment Officer, Global Asset Allocation (investing since 2010)
Adrian H. Chan, CFA, Portfolio Manager (investing since 2003)
James A. Fetch, CFA, Head of Portfolio Construction (investing since 1994)
Asset allocation can help to avoid extreme performance
Diversifying investments can be more effective than choosing one area of the market because performance leadership changes.
Explore the table below:
See how Putnam Dynamic Asset Allocation Growth Fund (AAG) avoids the extremes.
Select an asset class to see how the winners fluctuate from year to year.
- Putnam Dynamic Asset Allocation Growth Fund (AAG)
- Large-cap growth equities (LCG)
- Small-cap growth equities (SCG)
- Large -cap value equities (LCV)
- Small-cap value equities (SCV)
- International equities (IE)
- U.S. bonds (AGG)
- Cash
- Commodities (Comm.)
- U.S. TIPS (TIPS)
Data is historical. Past performance is not a guarantee of future results. Large-cap growth stocks are represented by the Russell 1000 Growth Index, which is an unmanaged index of capitalization-weighted stocks chosen for their growth orientation. Small-cap growth stocks are represented by the Russell 2000 Growth Index, which is an unmanaged index of those companies in the Russell 2000 Index chosen for their growth orientation. Large-cap value stocks are represented by the Russell 1000 Value Index, which is an unmanaged index of capitalization-weighted stocks chosen for their value orientation. Small-cap value stocks are represented by the Russell 2000 Value Index, which is an unmanaged index of those companies in the Russell 2000 Index chosen for their value orientation. Large-cap stocks are represented by the S&P 500 Index, which is an unmanaged index of common stock performance. Mid-cap stocks are represented by the Russell Midcap Index, an unmanaged index that measures the performance of the 800 smallest companies in the Russell 1000 Index. International stocks are represented by the MSCI EAFE Index (ND), which is an unmanaged index of international stocks from Europe, Australasia, and the Far East. U.S. bonds are represented by the Bloomberg U.S. Aggregate Bond Index, which is an unmanaged index used as a general measure of fixed-income securities. Cash is represented by the ICE BofAML U.S. 3-month T-Bill Index, which is an unmanaged index used as a general measure for money market or cash instruments.
The Morningstar Rating™ for funds, or "star rating," is calculated for managed products (including mutual funds, variable annuity and variable life subaccounts, exchange-traded funds, closed-end funds, and separate accounts) with at least a 3-year history. Exchange-traded funds and open-ended mutual funds are considered a single population for comparative purposes. It is calculated based on a Morningstar Risk-Adjusted Return measure that accounts for variation in a managed product's monthly excess performance, placing more emphasis on downward variations and rewarding consistent performance. The top 10% of products in each product category receive 5 stars, the next 22.5% receive 4 stars, the next 35% receive 3 stars, the next 22.5% receive 2 stars, and the bottom 10% receive 1 star. The Overall Morningstar Rating for a managed product is derived from a weighted average of the performance figures associated with its 3-, 5-, and 10-year (if applicable) Morningstar Rating metrics. The weights are: 100% 3-year rating for 36–59 months of total returns, 60% 5-year rating/40% 3-year rating for 60–119 months of total returns, and 50% 10-year rating/30% 5-year rating/20% 3-year rating for 120 or more months of total returns. While the 10-year overall star rating formula seems to give the most weight to the 10-year period, the most recent 3-year period actually has the greatest impact because it is included in all three rating periods. Ratings do not take into account the effects of sales charges and loads.


