


Data is historical. Past performance is not a guarantee of future results. More recent returns may be more or less than those shown. Investment return will fluctuate. Performance assumes reinvestment of distributions and does not account for taxes. Performance data reflects the impact of a 0.50% management fee for class I shares, a 0.60% management fee for class II shares, a 0.75% management fee for class III shares, a 0.90% management fee for class IV shares, a 1.05% management fee for class V shares, and a 0.35% management fee for class X shares. In certain cases your plan's management fee may be lower and your return higher. For the most recent month-end performance, please call your plan's toll-free number. Please note, as of December 31, 2018, Putnam has restated performance for the Custom Retirement Advantage 2025 Index and Custom Retirement Advantage Maturity Index. Restated returns reflect a correction to the allocation of the custom benchmarks to align with the portfolios’ strategic weights.
Retirement Advantage 2035 Trust (Class X)
Comprehensively managed portfolios diversified to align with your retirement horizon
TargetDateVisualizer®
This new tool can help you sort and select target date managers based on their glide path objectives.
Try TargetDateVisualizerHighlights
Objective
Retirement Advantage Trusts seek to maximize returns while maintaining a level of risk appropriate for a person planning to retire on or about the calendar year designated in each trust's name.
Strategy and process
- Tailored to retirement Each trust's target date reflects when investors are expected to retire and determines the portfolio's asset allocation.
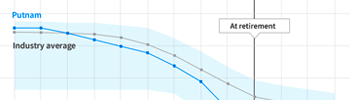
- Unique glide path Allocations are structured to pursue performance and downside protection near retirement.
- Comprehensively managed Putnam's seasoned Global Asset Allocation team implements all steps of the investment process - the glide path, tactical allocations, and security selection.
- Competitive CIT structure The trusts offer lower fee structure and the less complex administrative requirements of a collective investment trust, along with flexible pricing options.
Fund price and assets |
Prior close | 52-week high | 52-week low | Net assets and outstanding shares |
|---|---|---|---|---|
| Net asset value |
$26.05
0.81% | $0.21 |
$26.62
07/16/24 |
$20.73
10/27/23 |
Download CSV |
Fund facts as of 06/30/24
$884.52M
39%
--
5
September
74674P823 / 2406
01/05/18
Target Date
--
Management team


Literature
Fund documents |
| Factsheet (PDF) |
| Fund Profile: Retirement Advantage (35 bps) (PDF) |
| Annual Report (PDF) |
| Offering Statement (PDF) |
| Certification Letter (PDF) |
| For use by advisors (PDF) |
| For use by participants (PDF) |
| Quarterly commentary (PDF) |
| Retirement Advantage: targeting the right risk at the right time (PDF) |
| The glide path less traveled (PDF) |
| Optimizing the target-date glide path (PDF) |
| A glide path can help you stay on course to retirement (PDF) |
Why favor higher quality as credit squeeze tightens
Prudent credit selection is paramount as the Fed juggles monetary policy and financial security. Get Putnam’s insights on the SLOOS and the tightening credit squeeze.Getting personal: The future of target-date funds
New retirement innovations within personalized target-date funds are delivering demonstrable results.Performance
Total return (%) as of 06/30/24
Annual performance as of 06/30/24
Annualized Total return (%) as of 06/30/24
| Annualized performance | 1 yr. | 3 yrs. | 5 yrs. | 10 yrs. |
|---|---|---|---|---|
| At net asset value | 18.67% | 4.92% | 8.90% | 7.83% |
Performance snapshot
| At net asset value | |||
|---|---|---|---|
| 1 mt. as of 06/30/24 | 1.93% | ||
| YTD as of 07/26/24 or prior close | 11.18% | ||
Morningstar Ratings™ as of 06/30/24
| Time period | Funds in category | Morningstar Rating™ |
|---|---|---|
| Overall | 190 | |
| 3 yrs. | 190 | |
| 5 yrs. | 168 | |
| 10 yrs. | 107 |
Lipper rankings are based on total return without sales charge relative to all share classes of funds with similar objectives as determined by Lipper. Past performance is not indicative of future results.
Morningstar Ratings for the specific share classes only; other classes may have different performance characteristics.
The Morningstar Rating™ for funds, or "star rating", is calculated for managed products (including mutual funds, variable annuity and variable life subaccounts, exchange-traded funds, closed-end funds, and separate accounts) with at least a 3-year history. Exchange-traded funds and open-ended mutual funds are considered a single population for comparative purposes. It is calculated based on a Morningstar Risk-Adjusted Return measure that accounts for variation in a managed product's monthly excess performance, placing more emphasis on downward variations and rewarding consistent performance. The Morningstar Rating does not include any adjustment for sales loads. The top 10% of products in each product category receive 5 stars, the next 22.5% receive 4 stars, the next 35% receive 3 stars, the next 22.5% receive 2 stars, and the bottom 10% receive 1 star. The Overall Morningstar Rating for a managed product is derived from a weighted average of the performance figures associated with its 3-, 5-, and 10-year (if applicable) Morningstar Rating metrics. The weights are: 100% 3-year rating for 36–59 months of total returns, 60% 5-year rating/40% 3-year rating for 60–119 months of total returns, and 50% 10-year rating/30% 5-year rating/20% 3-year rating for 120 or more months of total returns. While the 10-year overall star rating formula seems to give the most weight to the 10-year period, the most recent 3-year period actually has the greatest impact because it is included in all three rating periods.
Some of Morningstar's proprietary calculations, including the Morningstar Rating™, are not customarily calculated based on adjusted historical returns. However, for new share classes/channels, Morningstar may calculate an extended performance Morningstar Rating that is based, in part, on adjusted historical (or "pre-inception") returns for periods prior to the inception of the share class of the fund shown herein ("Report Share Class").
The extended performance is calculated by creating a performance stream consisting of the Report Share Class and older share class(s). Morningstar adjusts the historical total returns of the older share class(es) of a fund to reflect higher expenses in the Report Share Class. Morningstar does not hypothetically adjust returns upwards for lower expenses.
The extended performance Morningstar Risk-Adjusted Return is then calculated for 3-, 5-, and 10-year time periods and used to determine the extended performance Morningstar Rating. The extended performance Morningstar Rating for this fund does not affect the retail fund data published by Morningstar, as the bell curve distribution on which the ratings are based includes only funds with actual returns. The Overall Morningstar Rating for multi-share open-end funds will be either based on actual performance only or extended performance only. Once the share class turns three years old, the Overall Morningstar Rating will be based on actual ratings only. The Overall Morningstar Rating for multi-share variable annuities is based on a weighted average of any ratings that are available.
While the inclusion of pre-inception data, in the form of extended performance, can provide valuable insight into the probable long-term behavior of newer share classes of a fund, investors should be aware that an adjusted historical return can only provide an approximation of that behavior. For example, the fee structures of a retail share class will vary from that of an institutional share class, as retail shares tend to have higher operating expenses and sales charges. These adjusted historical returns are not actual returns. The underlying investments in the share classes used to calculate the pre-performance string will likely vary from the underlying investments held in the fund after inception. Calculation methodologies utilized by Morningstar may differ from those applied by other entities, including the fund itself.
© 2023 Morningstar. All Rights Reserved. The information contained herein: (1) is proprietary to Morningstar and/or its content providers; (2) may not be copied or distributed; and (3) is not warranted to be accurate, complete or timely. Neither Morningstar nor its content providers are responsible for any damages or losses arising from any use of this information. Past performance is no guarantee of future results.
The up-market capture ratio is used to evaluate how well an investment manager performed relative to an index during periods when that index has risen. The ratio is calculated by dividing the manager’s returns by the returns of the index during the up-market, and multiplying that factor by 100. The down-market capture ratio is used to evaluate how well an investment manager performed relative to an index during periods when that index has dropped. The ratio is calculated by dividing the manager’s returns by the returns of the index during the down-market and multiplying that factor by 100.
Holdings
| Putnam Retirement Advantage GAA Balanced Trust | 89.36% |
|---|---|
| Putnam Retirement Advantage GAA Growth Trust | 5.85% |
| Putnam Stable Value Fund | 4.12% |
| Putnam Retirement Advantage Gaa Multi-Asset Income Portfoli | 0.40% |
| Putnam Retirement Advantage Gaa Conservative Trust | 0.30% |
| Top holdings as of 06/30/24 | |
|---|---|
| Putnam Retirement Advantage GAA Balanced Trust | 89.36% |
| Putnam Retirement Advantage GAA Growth Trust | 5.85% |
| Putnam Stable Value Fund | 4.12% |
| Putnam Retirement Advantage Gaa Multi-Asset Income Portfoli | 0.40% |
| Putnam Retirement Advantage Gaa Conservative Trust | 0.30% |
| Top holdings as of 05/31/24 | |
|---|---|
| Putnam Retirement Advantage GAA Balanced Trust | 89.28% |
| Putnam Retirement Advantage GAA Growth Trust | 5.83% |
| Putnam Stable Value Fund | 4.22% |
| Putnam Retirement Advantage Gaa Multi-Asset Income Portfoli | 0.40% |
| Putnam Retirement Advantage Gaa Conservative Trust | 0.30% |
| Top holdings as of 04/30/24 | |
|---|---|
| Putnam Retirement Advantage GAA Balanced Trust | 89.13% |
| Putnam Retirement Advantage GAA Growth Trust | 5.79% |
| Putnam Stable Value Fund | 4.40% |
| Putnam Retirement Advantage Gaa Multi-Asset Income Portfoli | 0.40% |
| Putnam Retirement Advantage Gaa Conservative Trust | 0.30% |
| Top holdings as of 03/31/24 | |
|---|---|
| Putnam Retirement Advantage GAA Balanced Trust | 88.24% |
| Putnam Retirement Advantage GAA Growth Trust | 7.86% |
| Putnam Stable Value Fund | 3.92% |

Consider these risks before investing: If the quantitative models or data that are used in managing an underlying fund prove to be incorrect or incomplete, investment decisions made in reliance on the models or data may not produce the desired results and the fund may realize losses.
Our allocation of assets among permitted asset categories may hurt performance. The value of investments in the underlying funds’ portfolios may fall or fail to rise over extended periods of time for a variety of reasons, including general economic, political, or financial market conditions; investor sentiment and market perceptions; government actions; geopolitical events or changes; and factors related to a specific issuer, asset class, geography, industry, or sector. These and other factors may lead to increased volatility and reduced liquidity in the underlying funds’ portfolio holdings.
Growth stocks may be more susceptible to earnings disappointments, and value stocks may fail to rebound. Investments in small and/or midsize companies increase the risk of greater price fluctuations. Bond investments are subject to interest-rate risk (the risk of bond prices falling if interest rates rise) and credit risk (the risk of an issuer defaulting on interest or principal payments). Default risk is generally higher for non-qualified mortgages. Interest-rate risk is generally greater for longer-term bonds, and credit risk is generally greater for below-investment grade bonds. Lower-rated bonds may offer higher yields in return for more risk. Funds that invest in government securities are not guaranteed. Mortgage-backed securities are subject to prepayment risk, which means that they may increase in value less than other bonds when interest rates decline and decline in value more than other bonds when interest rates rise. The underlying funds may have to invest the proceeds from prepaid investments, including mortgage and asset backed investments, in other investments with less attractive terms and yields. International investing involves currency, economic, and political risks. Emerging market securities carry illiquidity and volatility risks. REITs are subject to the risk of economic downturns that have an adverse impact on real estate markets. Convertible securities’ prices may be adversely affected by underlying common stock price changes. While convertible securities tend to provide higher yields than common stocks, the higher yield may not protect against the risk of loss or mitigate any loss associated with a convertible security’s price decline. Convertible securities are subject to credit risk. Risks associated with derivatives include increased investment exposure (which may be considered leverage) and, in the case of over-the-counter instruments, the potential inability to terminate or sell derivatives positions and the potential failure of the other party to the instrument to meet its obligations. There is no guarantee that the funds will provide adequate income at and through an investor’s retirement.
Our investment techniques, analyses, and judgments may not produce the outcome we intend. The investments we select for the underlying funds' may not perform as well as other securities that we do not select for the underlying funds'. We, or the fund’s other service providers, may experience disruptions or operating errors that could have a negative effect on the underlying funds'. You can lose money by investing in the funds.
Expenses
Expense ratio |
Class I | Class X | Class II | Class IV | Class V |
|---|---|---|---|---|---|
| Total expense ratio | 0.50% | 0.35% | 0.60% | 0.90% | 1.05% |
| What you pay | 0.50% | 0.35% | 0.60% | 0.90% | 1.05% |
The Retirement Advantage Custom Benchmarks are unmanaged indexes administered by Putnam Management, consisting of various indexes that follow the underlying strategies of the portfolios. You cannot invest directly in an index.
Consider these risks before investing: If the quantitative models or data that are used in managing an underlying fund prove to be incorrect or incomplete, investment decisions made in reliance on the models or data may not produce the desired results and the fund may realize losses.
Our allocation of assets among permitted asset categories may hurt performance. The value of investments in the underlying funds’ portfolios may fall or fail to rise over extended periods of time for a variety of reasons, including general economic, political, or financial market conditions; investor sentiment and market perceptions; government actions; geopolitical events or changes; and factors related to a specific issuer, asset class, geography, industry, or sector. These and other factors may lead to increased volatility and reduced liquidity in the underlying funds’ portfolio holdings.
Growth stocks may be more susceptible to earnings disappointments, and value stocks may fail to rebound. Investments in small and/or midsize companies increase the risk of greater price fluctuations. Bond investments are subject to interest-rate risk (the risk of bond prices falling if interest rates rise) and credit risk (the risk of an issuer defaulting on interest or principal payments). Default risk is generally higher for non-qualified mortgages. Interest-rate risk is generally greater for longer-term bonds, and credit risk is generally greater for below-investment grade bonds. Lower-rated bonds may offer higher yields in return for more risk. Funds that invest in government securities are not guaranteed. Mortgage-backed securities are subject to prepayment risk, which means that they may increase in value less than other bonds when interest rates decline and decline in value more than other bonds when interest rates rise. The underlying funds may have to invest the proceeds from prepaid investments, including mortgage and asset backed investments, in other investments with less attractive terms and yields. International investing involves currency, economic, and political risks. Emerging market securities carry illiquidity and volatility risks. REITs are subject to the risk of economic downturns that have an adverse impact on real estate markets. Convertible securities’ prices may be adversely affected by underlying common stock price changes. While convertible securities tend to provide higher yields than common stocks, the higher yield may not protect against the risk of loss or mitigate any loss associated with a convertible security’s price decline. Convertible securities are subject to credit risk. Risks associated with derivatives include increased investment exposure (which may be considered leverage) and, in the case of over-the-counter instruments, the potential inability to terminate or sell derivatives positions and the potential failure of the other party to the instrument to meet its obligations. There is no guarantee that the funds will provide adequate income at and through an investor’s retirement.
Our investment techniques, analyses, and judgments may not produce the outcome we intend. The investments we select for the underlying funds' may not perform as well as other securities that we do not select for the underlying funds'. We, or the fund’s other service providers, may experience disruptions or operating errors that could have a negative effect on the underlying funds'. You can lose money by investing in the funds.