Putnam Dynamic Low Volatility Excess Return Index (PDLV5E)

Combines stocks, bonds, and cash to pursue consistent, attractive returns.

Pursues attractive long-term performance with consistency over shorter time periods

Index level as of 04/24/24
372.39
One-day change as of 04/24/24
-0.40 (-0.11%)
  • Annualized returns as of 03/31/24
  • Annual returns
YTD* 1 yr. 3 yrs. 5 yrs. 10 yrs.
0.47% -2.86% -2.69% -0.14% 2.81%

*Returns of less than one year are cumulative.

Month-end allocations (past 12 months)

23-Apr 23-May 23-Jun 23-Jul 23-Aug 23-Sep 23-Oct 23-Nov 23-Dec 24-Jan 24-Feb 24-Mar Prior business day
Stocks 8.2% 9.8% 35.3% 35.6% 27.4% 26.9% 21.8% 22.3% 22.4% 43.1% 36.5% 37.0% 22.5%
Bonds 47.1% 59.6% 64.7% 64.4% 51.1% 51.0% 41.4% 41.7% 42.2% 39.8% 32.5% 32.2% 54.8%
Cash 44.7% 30.5% 0.0% 0.0% 21.5% 22.1% 36.8% 36.0% 35.4% 17.1% 31.1% 30.7% 22.7%

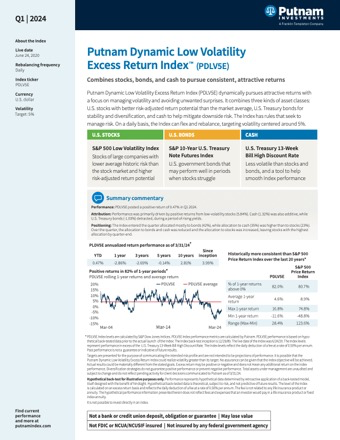
Source: S&P Dow Jones Indices, LLC.

The Index is composed of the S&P 500 Low Volatility Index (Stocks), S&P 10-Year U.S. Treasury Note Futures Index (Bonds), and U.S. Treasury 13-Week Bill High Discount Rate (Cash). Allocations shown may not total 100% due to rounding.

The Index is rebalanced daily. Allocations shown are as of the last day of the month for each month listed. Historical asset allocations are hypothetical prior to 6/24/20 and live thereafter. Hypothetical allocations illustrate how the Putnam Dynamic Low Volatility Excess Return Index would have responded to market conditions from 8/31/19 through 6/24/20 had it existed. The information does not represent the current allocations of the Index. It is only provided as an example of how the allocations would have worked in certain market environments. Asset allocation strategies do not guarantee positive performance or prevent negative performance. Past performance is not a guarantee of future results.

Historical asset allocations prior to June 24, 2020, are hypothetical and illustrate how the Putnam Dynamic Low Volatility Excess Return Index would have responded to market conditions had it existed. The information does not represent the current allocations of the Index. It is only provided as an example of how the allocations would have worked in certain market environments. No future asset allocations of the Index can be predicted based on the simulated asset allocations described herein. The live date of the Index was June 24, 2020. Asset allocation strategies do not guarantee positive performance or prevent negative performance.

PDLV5E annualized return performance is as of most recent month-end period.

The Putnam Dynamic Low Volatility Excess Return Index (PDLV5E) performance is based on hypothetical back-tested data prior to the actual launch of the Index: The Index back-test inception is December 29, 1989. The live date of the Index was June 24, 2020. The hypothetical back-testing period is December 29, 1989–June 24, 2020. Returns are shown in U.S. dollars. Past performance is not a guarantee of future results.

Hypothetical back-test for illustrative purposes only. Prior to June 24, 2020, performance represents hypothetical data determined by retroactive application of a back-tested model, itself designed with the benefit of hindsight. Hypothetical back-tested data is theoretical, subject to risk, and not predictive of future results. The Index levels reflect the daily deduction of a fee at a rate of 0.5% per annum. The fee is not related to any annuity. The hypothetical performance information presented herein does not reflect fees and expenses that an investor would pay in a fixed index annuity.

It is not possible to invest directly in an index.

Highlights

A rules-based index that avoids unwanted surprises

Putnam Dynamic Low Volatility Excess Return Index dynamically pursues attractive returns with a focus on controlling volatility and avoiding unwanted surprises. It combines three kinds of asset classes: U.S. stocks with historically better risk-adjusted returns than the market average, U.S. Treasury bonds for stability and diversification, and cash for protection against losses. The Index has rules that seek to manage risk. On a daily basis, the Index can flex and rebalance, targeting volatility centered around 5%.

Key Statistics

Ticker: PDLV5E
Live Date: 06/24/20
Volatility Target: 5%
Rebalancing Frequency: Daily
Currency: U.S. dollar
Asset Class Range: 0%–100% each
  • Pursues consistent returns
    PDLV5E pursues consistent, attractive returns with a simple mix of stocks, bonds, and cash and a dynamic process to control volatility.
  • Low-volatility stocks
    The stocks represent large U.S. companies that have lower volatility and better historical risk-adjusted returns than the S&P 500 Index.
  • Daily, dynamic rebalancing
    The Index adjusts allocations on a daily basis to target 5% volatility, using a trading rule that seeks improved, risk-adjusted returns, and can rapidly increase cash when markets become shaky.

Excess return may be positive or negative and does not mean any additional return on the index performance. Targets are presented for the purpose of communicating the intended risk profile and are not intended to be projections of performance. It is possible that the Putnam Dynamic Low Volatility Excess Return Index ("PDLV5E" or "the Index") could realize a volatility greater than its target. No assurance can be given that the Index objective will be achieved. Actual results could be materially different from the stated goals. Asset allocation strategies and diversification do not assure a profit and do not protect against loss. As with any investment, there is a potential for profit as well as the possibility of loss.

The Index is the exclusive property of Putnam Investments and is made and compiled without regard to the needs, including, but not limited to, the suitability needs, of any insurance company, index annuity, or owners of any index annuity. Index annuities are insurance contracts, not registered securities or stock market investments. Index annuities are not invested in the index itself, but rather interest is credited based on the performance of the index and the rules prescribed in the insurers index crediting strategy. Index annuities are not issued by Putnam Investments.

Hypothetical back-test data has many built-in limitations, some of which are described below. The hypothetical back-test performance information in this presentation reflects application of an Index methodology and selection of index constituents prepared with the benefit of hindsight. No theoretical approach can take into account all of the factors in the markets in general and the impact of decisions that might have been made during the actual operation of an index. Actual results may vary, perhaps materially, from the simulated results presented. There are numerous factors related to the markets in general or the implementation of any specific investment strategy, which cannot be fully accounted for in the preparation of simulated results and all of which can adversely affect actual results. No representation is being made that any account, product, or strategy will or is likely to achieve profits, losses, or results similar to those shown.

This material has been prepared for informational use and is provided for limited purposes. By receiving and reviewing this material, the recipient acknowledges the following: This material is a general communication being provided for informational and educational purposes only. It is not designed to be a recommendation of any specific investment product, strategy, or decision, and is not intended to suggest taking or refraining from any course of action. The material was not prepared, and is not intended, to address the needs, circumstances, and objectives of any specific institution, plan, or individual(s). Putnam is not providing advice in a fiduciary capacity under applicable law in providing this material, which should not be viewed as impartial, because it is provided as part of the general marketing and advertising activities of Putnam, which earns fees when clients select its products and services. The views and strategies described herein may not be suitable for all clients. Prior to making any financial decisions, any recipients of this material should seek individualized advice from their personal financial, legal, tax, and other professional advisors that takes into account all of the particular facts and circumstances of their situation. Unless otherwise noted, Putnam is the source of all data. Putnam Investments cannot guarantee the accuracy or completeness of any statements or data contained in the material. All financial decisions involve risk, and recommendations may not always be profitable, including possible loss of principal. Putnam Investments does not guarantee any minimum level of performance or the success of any strategy. Past performance does not guarantee or indicate future results.